1. Introduction
In the study of the relationship between urban form and resource consumption, there are differing conclusions concerning the impact of dense urban form. For example, reduced transport energy consumption has been shown to correlate with increased urban density (Newman & Kenworthy, 1989), household space heating energy consumption reduces with compact house forms (Rode et al, 2014) and more general unsupported claims are also made (Leung, 2016; Albino et al, 2015; Nia, 2017). However, other studies have indicated that CO2 emissions from transport and electricity consumption per capita show little correlation with the density of urban areas (Hammer et al, 2011) and there is evidence that dispersed urban forms are more energy efficient when disruptive technologies such as photovoltaics to charge electric vehicles (the more likely technologies of the future) (Byrd et al 2013) are widespread and there is empirical evidence demonstrating that compact residential building forms are less energy efficient (Myers et al, 2005; Byrd et al 2012).
However, policies on urban form tend to favour compaction but there is little evidence of what densities urban form should target to optimise resource consumption (Steadman, 2015). While some studies have indicated an optimum density of about 18 dwellings per Ha (Gosh et al, 2006) most policies advocating increased density (Sridhar, 2010) stay clear of a density target which can result in the impression that the denser; the more efficient. If that is the case, the consequences of urban forms of very high-density need to be understood and the implications back-casted to inform cities with policies of increased compaction.
This research concerns the densest city in the world, Mumbai, and the environmental impact of the proposed redevelopment proposals that are likely to increase densities from about 3,500persons per hectare to about 5,000, achieved by demolition of existing 3-5 storey height buildings and replacing them with towers averaging 40 floors. What has become known in Mumbai as ‘vertical with a vengeance’ (Rathod, 2012).
The study investigates the environmental impact of a proposed redevelopment of a 16.5-acre site. Of the many redevelopment proposals in Mumbai, this is in the most advanced stage and is an exemplar for both Mumbai in its ambition to become a ‘global city’ and the Indian Government who have identified it as a key development in their proposal to achieve 100 ‘smart’ cities (Government of India, 2015).
The study firstly compares the existing urban form with the proposed form. For example, numbers and heights of buildings, density of dwelling and population, parking provision, open space, landscaping and street frontages. It uses the extended urban metabolism model (Newman et al, 1996) as a basis of analysis and predicts the flows of water supply (reticulated and rainwater harvesting), drainage, solid waste, electricity supply, potential for solar energy, fuel for transport, carbon dioxide production and sequestration.
From the results of the 16.5-acre site, the analysis is then extrapolated to the overall impact if similar developments were to be carried out, as is proposed, across all of the Island city of Mumbai. The results indicate that metabolism does not increase linearly (on a per capita basis) with density but accelerates instead. The results also indicate that the compact urban form increases dependence on infrastructure security and that the increased demand of water and electricity is unlikely to be supplied in a reasonably reliable and secure manner. Furthermore, the outputs (waste water, solid wastes, and carbon dioxide production) would increase disproportionately resulting in both health and accelerated climate change issues. The Indian Government (2015) has claimed this type of development to be sustainable, environmentally friendly and ‘smart’. This research indicates the opposite may be more likely.
2. Background to the development Proposals
The Island City of Mumbai trebled in population over a period of about 50 years (1931-1981) mainly due to rural-to-urban migration (Census of India, 2011). The population peaked and has subsequently experienced a marginal decline as the suburbs have grown. The migrants into the City were protected by the Mumbai Rent Restriction Act (1939) limiting returns on landlord’s investments and resulting in disrepair of the housing stock. As a result, in 1969, the “cess” tax was introduced and a levy placed on landlords by the municipal authorities who took over property repairs. Regulated rent levels combined with the ‘cess’ tax made redevelopment financially unattractive. Added to this were limitations on the ratio of site area to floor area of developments (FSI). In the first Development Plan of Bombay (1964), FSI was limited to 1.66. But with few new developments and, in order to try and encourage developers, this was eased to 2 in 1984 and then 3 in 1991 and 4 in 2009. These inducements had little impact and relatively few high-rise housing was built. The ‘cessed’ property (generally 3-5 storeys) predominated (Bertaud, 2013).
The cessed properties did not conform with the image that the municipal authorities wanted to see of the City that was the financial capital of India. In 2011, Mumbai hosted the Tall Building conference and announced its proposals to redevelop the city by demolition of cessed property and replacing it with towers with the intention of being perceived as a “global” city (CBTUH, 2010). Further FSI incentives were again introduced in 2009 by Development Control Rules (DCR 33(9)) provided developments were of a significant scale. This triggered new development proposals and one of the first and largest developments was proposed at Behndi Bazaar, Ward C in the Island City. A 16.5 acre site containing 247 buildings (typically 3-5 storey) are due to be demolished and replaced by 30 towers of between 40 to 60 floors (a built-up area of almost 11 times greater than the site area).
3. From global to smart city
In 2015, the Indian Government proposed 100 “smart” cities (Government of India, 2015a) and named Behndi Bazaar as its exemplar development that was a flagship of ‘smartness’. Although the definition of a ‘smart city’ can be vague (Albino et al, 2015) the Government has clearly defined their intentions (Government of India, 2015b)) that are summarised below:
i. adequate water supply
ii. Assured electricity supply
iii. Sanitation, including solid waste management
iv. Efficient urban mobility and public transport
V. Affordable housing, especially for the poor
Vi. Robust IT connectivity and digitalization
vii. Good governance, especially e-Governance and citizen participation,
viii. Sustainable environment
ix. Safety and security of citizens, particularly women, children and the elderly
X. health and education
xi. Reduce congestion, air pollution and resource depletion
At least half of these criteria are environmental objectives, which can be measured and reasonably accurately predicted. Because, governance, health and education policies could be implemented without redevelopment, this study focuses on all the environmental elements that are a direct result of the Governments ‘smart’ proposals.
4. Method of analysis
In order to test the claims that the exemplar development met the ‘smart’ criteria put forward by the Government, the study was undertaken in three stages:
1) analyse the physical characteristics of the new exemplar development and compare these with the existing,
2) evaluate the environmental performance of both the existing and new for comparative purposes,
3) Extrapolate the results of the case study across the whole of the Island City to establish the full impact of a ‘smart’ city.
5. Data collection of the development
Data was collected from various primary and secondary sources including; physical surveys during site visits, from local government agencies, NGOs, the construction industry and desk-based research.
The Mumbai Transformation and Support Unit provided information and maps of cessed properties of the seven wards on Mumbai City and data for the 1,135 projects approved for redevelopment, under DCR 33(7), in the Island city. These data were used in extrapolating the result of the case study to the district level. The Building Proposals Department of Mumbai provided the master plans and area statement for the Bhendi Bazaar case study. Surveyors for the Bhendi Bazaar project provided detailed floor plans and area statements of the existing buildings on the site and a master plan of the proposed development.
This data allowed an analysis of the physical characteristics of the existing and new developments. A three-dimensional model of both the existing and proposed developments was constructed (Figures 1 & 2). This was used to establish the morphological changes (building heights, street widths, parking provision, roof areas, open space, landscaping and other aspects of built form). Demographic changes (population density, total population) were based on census data for the existing and the developer’s calculations for the proposed development together with an assessment of population based on space provision.
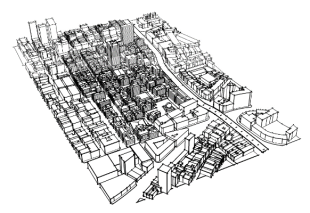
Figure 1. The existing site at Bhendi Bazaar on the Island City of Mumbai.
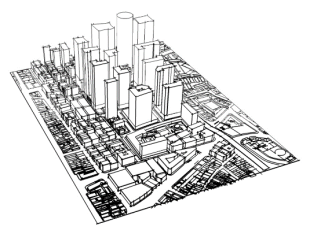
Figure 2. The proposed development that is claimed to be an example for ‘smart’ cities in India.
Understanding the magnitude of the built form and population increase of the development allowed an analysis of the additional resources required for the new development and hence and assessment of the environmental impact.
5.1 Measuring the environmental impact
The method used to predict the environmental impact of the development proposals was based on the extended urban metabolism model. This provides a basis for measuring flows of resources that are both consumed by and flow from the city. The study focused on the operational flows rather than embodied resources in the materials of the buildings and infrastructure. While the latter are of importance, they are relatively small over the lifecycle of urban structures and the study does not question whether or not redevelopment should occur; only the appropriateness of the proposed built form.
The flows of resources consist of water and energy as inputs and wastes and pollution as outputs. Water inputs include reticulated supplies from the various dams outside the City as well as rainwater harvesting. Energy includes electricity from the grid as well as potential electricity generated from roof-mounted photovoltaics. It also includes fuels required for transport as well as carbon sequestration by landscape proposals. The outputs include wastewater, solid wastes and carbon dioxide production.
If the Government’s claims are correct, then the compaction of built form should result in a proportionate reduction (or at least no increase) of the inflow of resources and outflow of waste products per capita due to efficiencies of scale and improved infrastructure.
Since the development has not been constructed, the flows for the proposed development were predicted based partly on empirical evidence from precedents and supported by calculation from first principles. The full extended urban metabolism analysis together with the calculations and resulting data can be viewed at Mandal (2015).
For example, the predicted electricity consumption was based on the empirical evidence of energy use in different residential built forms in Sydney (Myors et al, 2005), a sub-tropical climate. This research found that metered energy use, in a sample of over 3,500 different house units, increased with the height of residential developments due mostly to energy consumed in common areas (corridors, car parks, pumping of water and wastes).
Therefore, in order to calculate the energy use in the proposed development of the Mumbai case study, all the energy use in the building was calculated including, for example, private and common lighting, air-conditioning, air extraction in basement car parks, pumping of water, passenger lifts. The energy use was calculated based on the energy rating and hours of operation. The carbon dioxide emissions form electricity generation are calculated based on electricity consumption and the carbon emission content of the generating fuels (mostly coal in this case). Transport energy was based on the number of private vehicles (both cars and ‘two-wheelers’) in the development, their travel frequency and travel distance. While frequency and distance of travel was considered to be similar for both the new and existing developments, the number of car parking spaces in the proposed development is significantly greater. The potential of renewable energy from photovoltaics (PV) was calculated based on available roof area and typical efficiencies of PV installations. Similarly, water consumption was based on the number of occupants, type of appliances and duration of use and wastewater calculations are directly related to water supply.
5.1.1 Environmental dynamics
Increased consumption of resources and production of wastes is not necessarily linear with the increase in population. The provision of new facilities induces an increased rate of consumption. Anticipated resource efficiency from the technologies of the new development are unlikely to be achieved due to behavioural responses; an issue in Mumbai identified by Yelda (2006) concerning the dynamics of environmental problems in Mumbai.
For example, the provision of additional 3,000 new car parking spaces in a city that has few existing parking spaces, induces people, particularly in a developing economy, to buy a car. As a conservative estimate, this study assumed that only 80% of the new parking spaces would be filled. However, since car ownership in the City was restricted due to a lack of car parking spaces, the new provision has significant consequences on energy consumption and subsequent pollution.
Similarly, a significant increase in energy use is attributed to air-conditioning due to a combination of an increased size in residential units, increased cooling loads because of the loss of mutual shading from low to high-rise built form and an increasing ownership (for both status and comfort purposes) of air-conditioning units (Tembhekar, 2009). This is also apparent in the retail areas of the development where the traditionally naturally ventilated shallow-plan retail spaces along street frontages are replaced, in the new development, by deep-plan retail outlets that are necessarily dependent on air conditioning.
In the case of water consumption, the increase will not be linear with the additional population since the new development offers significant additional means for water usage. While many of the existing cessed properties have communal washing facilities, the new development offers each individual unit outlets for toilets, showers and washing facilities. Showers and washing machines. This results in not only an increase in the number of water-consuming appliances but also offers the opportunity of increased duration of use.
In the common areas, the increased amount of container planting (used as a mechanism to comply with planning requirements for increased landscaping) demands an additional water supply, unlike trees planted in the ground. The significant increase in the number of cars also results in a proportionate increase in car washing.
5.1.2 The results; spatial and demographic characteristics.
With the exception of the existing religious structures mosque and one tower block, the whole site is to be demolished and rebuilt. Figure 3 compares the number of existing and proposed buildings on the site. The fine urban grain of the cessed buildings is lost to large individual buildings resulting in a tenfold reduction in the total number of buildings. Figure 4 indicates the number of proposed tower blocks the highest being 62 floors.
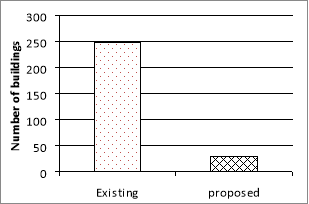
Figure 3. Comparison of the number of buildings for the existing and proposed development.
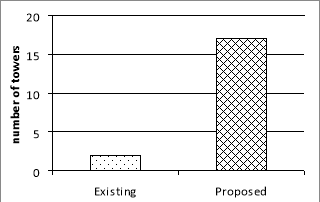
Figure 4. Comparison of the number of residential towers for the existing and proposed development.
These statistics explain why the development proposals have been named “vertical with a vengeance” and the increase in FSI, to almost 4.8, is indicative of the financial incentive that has been historically hampered by restrictions on the permitted FSI.
Related to this is the density of the development (Figure 5) that has increased by over 25% to almost 1000 units per hectare. However, the population density of individual units is likely to decrease as the unit sizes have increased by an average of 20%. This potentially results in more space per person in the units but assumes that the increased space standards will be realised rather than increased numbers for each tenancy to fill them up to previous standards.
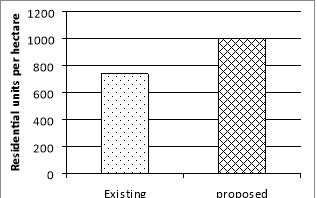
Figure 5. Comparison of the density of residential units per hectare.
The external open space of the proposed development is greater due to the site coverage slightly decreasing from 90% to 73% of the total site. However, the open space per person has reduced to 1.07 sq. m per person, from 1.27 sq. m per person which is only about 1/7th the recommendation of the World Health Organisation (sustainablecitiesnetwork, 2011).
The large podiums have replaced the small streets and alleyways resulting in a significant reduction (63%) in the perimeter length (active frontages) of all buildings at ground level, much of which is dedicated to small commercial enterprises in the existing development. This is likely to reduce the number of small retail businesses that spread onto the pavement and result in larger units that are spread deeper under the new blocks and become dependent on air-conditioning and artificial lighting.
The number of trees on the site has increased by over 700 with about 40% of these being in containers on the roofs of podiums. These trees will assist with planning compliance for the development, but trees in containers on the flat roofs of the podiums will offer little beneficial cooling or carbon sequestration due to their limited size. They will also require constant watering outside the monsoon period.
5.2 Environmental consequences
5.2.1 Water collection and consumption
Water demand in the new development (Figure 6) is calculated to be more than double the existing (232% increase). This is partly due to the cleaning required to the increased amount of common areas and also the amount of trees and shrubs (above ground level) that require irrigation outside the monsoon period. However, the bulk of increased water usage comes from greater use within apartments. The reduction in shared bathing/toilet facilities, increased number of private water taps (sink, basins, showers, washing machine) and the ‘take-back’ effect of potentially more efficient water control systems being offset by a change of behaviour in the use of the appliances (duration of use of bathrooms or use of washing machines).
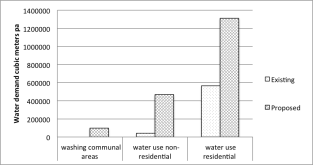
Figure 6. Comparison of existing and proposed water demand by different users.
The reduction in site coverage and the taller, but fewer, buildings results in a decrease in overall roof area of 32% with the same decrease in rainwater harvesting potential (a mandatory requirement in Mumbai) resulting in less than half (45%) the potential amount of rainwater per person (Figure 7).
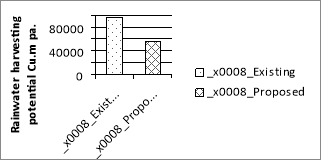
Figure 7. Comparison of rainwater harvesting potential.
5.2.2 Sewage and wastewater
Related to the additional water consumption is the sewage and wastewater generated by the new development. Sewage will be proportional to the increase in population. However, there will be significantly more wastewater related to the increased appliances and change in lifestyles.
The increased population on the site, with consequent increased wastewater and sewage, results in a sewage volume that has more than doubled (234% increase) and reached 4.64 million litres per day. At present the sewage treatment plant for the zone (Worli) manages to treat less than 20% of the sewage, the rest is pumped directly to the sea without treatment. The increased sewage volume will result in less than 10% being treated unless there is sewage treatment on site.
5.2.3 Electricity consumption
Residential electricity is the largest consumer on the site and almost doubles (196% increase) in the proposed development (Figure 8). This is combined with two new loads incurred by the development: i) lighting and ventilation to basement and podium car parks amounting to about 6% of the total residential load and ii) electricity use for other communal facilities that include; pumping water to the towers, lifts and lighting of corridors all of which amount to about 9% of the total residential load.
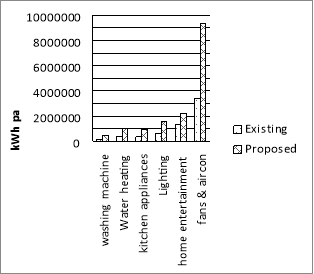
Figure 8. Comparison of residential electricity use.
The increased residential electrical load is due to several factors. The average floor area of each unit has almost doubled which results in additional lighting, fans and air-conditioning use. Dedicated water heating with larger volumes of water results in increased hot water usage especially with individual use of modern washing machines. Household appliances (e.g. microwaves, home entertainment and larger television screens) are likely to become commonplace and used more frequently. However, air-conditioning is likely to become the single largest consuming item as the demand for increased comfort and status that comes with air-conditioning spreads (Tembhehar, 2011).
Electricity consumed by commercial and retail spaces will more than double (226% increase) in the new development (Figure 9). This is due mainly to the configuration of the commercial areas that, although having the same overall floor area as the existing development, have an external perimeter that has decreased by 63%. This reduces both daylighting and cooling by natural ventilation resulting in increased use of fans and air-conditioning as well as artificial lighting (Byrd, 2012). Although the light fittings may tend to be more efficient, this is likely to be offset by the opportunity for increased display lighting in retail areas.
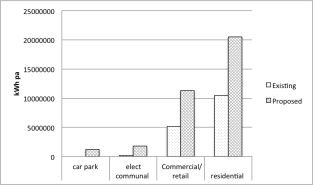
Figure 9. Comparison of all electricity uses.
Other miscellaneous appliances include the increased use of computers, display screens, electronic retail systems and signage. All of these not only directly increase the electrical load but also increase the cooling load within the retail and commercial spaces. Although refrigerators in retail areas may become more efficient, they are also likely to increase as the area will become more affluent and increase the demand for more pre-prepared food.
5.2.4 Carbon emissions
Considering only the carbon emissions in the operation of the development, the two main contributors are the carbon due to additional electricity generation and the emissions due to the additional private vehicles that can now be housed on the site (Figure 10). The carbon emissions in electricity generation in Maharashtra average about 0.9 tCO2/MWh reflecting the high proportion of coal-fired generation.
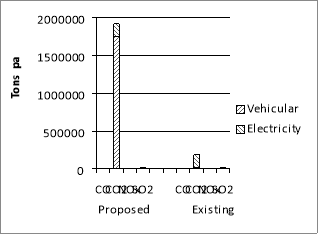
Figure 10. Comparison of Greenhouse gas emissions from electricity production and private vehicles.
The total additional electricity use for the proposed development is 18,326 MWhrs/year that equates to16, 494 tCO2 per year. However, only a proportion of this is directly due to the nature of the development. The operation of the car parks (extraction fans and permanent lighting), lifts, pumping, common areas, air-conditioning and lighting, for non-residential, and a proportion of air-conditioning for residential are directly attributable to the nature of the development.
This amounts to approximately half of the additional electricity load, making the development attributable to 8,247 tCO2 per year due to the increased electricity demand.
The amount of carbon emissions as a direct result of providing car parking spaces, where there were none previously, will depend on the type of vehicles and their travel patterns. The reduction in emissions due to changes of fuel (in particular CNG) has been assumed to be offset due to an increase in congestion as car ownership grows rapidly. Assuming 16 km/litre of fuel, the average carbon emissions per vehicle are 200gCO2/km. It is assumed that 80% of the 1400 car parking spaces are occupied and used regularly and that the average travel distance is 6km per day for recreation, occasional shopping and school drop-offs. This amounts to 25 kg per day or 491 tCO2 per year.
5.2.5 Solid waste
The per capita generation of solid wastes in Mumbai has been steadily increasing and reached 0.63Kg/person/day in 2004 (Mahadevia, Pharate, & Mistry, 2005). It should be noted that in addition to the land required for dumping the waste, a considerable amount of energy is spent in sorting, transporting and processing the waste in addition to the greenhouse gases released from their decomposition. The overall increase in solid waste is anticipated to increase by 30% per capita due largely to increased affluence (Figure 11).
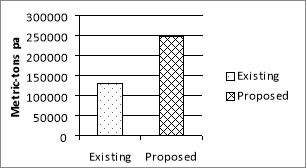
Figure 11. Comparison of solid waste generated.
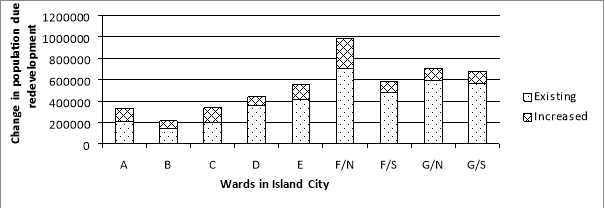
6. Extrapolating the results across the Island City
The results above are for the 16.5-acre site, Bhendi Bazaar that has been named as an exemplar development for the proposed ‘smart’ cities in India. To investigate what the impact would be if the development was replicated across a city, the analysis was extrapolated across Mumbai’s Island city.
The development potential of the City is related to the number of ‘cessed’ properties that can be demolished and redeveloped. Figure 12 indicates the increase in population in each of the City’s wards should the Bhendi Bazaar project be replicated. The different proportions of increased growth relate directly to the proportion of cessed properties in each ward. The case study area considered above is in Ward C.