1. Introduction
With the alarming rate of environmental challenges, it is important to intensify efforts that can promote a better understanding of the environment and engender positive ecological behaviours among the urban population across the globe. One major area of research in the built environment that can promote local and global ecological sustainability is the exploration of different strategies for deepening understanding of the environment as the basis for human existence. Researchers generally agree that such strategies must be geared towards an understanding of people’s feelings and attitudes toward environmental issues (Kovács et al., 2014; Steg et al., 2014). Empirical studies have confirmed a strong relationship between attitudes and ecological behaviours as evidenced in the various environmental attitudes (EA) scales developed over the years. Moreover, research on the environment is gaining momentum, especially arising from the need to develop strategies to mitigate human-induced environmental problems. Several studies have argued that many of these problems are products of human behavioural tendencies (Giusti & Samuelsson, 2020; Ogunbode, 2013; Santiago et al., 2015; Steg & Vlek, 2009; Zuniga-Teran et al., 2019). Thus, studies that help to improve understanding of people’s way of life, organization and their use and disposition toward their environment are necessary for identifying strategies for encouraging environmental attitudes that can promote a quality and sustainable environment in the population (Erdogan, 2009; Steg et al., 2014; Vlek & Steg, 2007).
However, in the quest to develop a positive attitude among urban dwellers it is also imperative to explore the influence of green infrastructure in residential neighbourhoods, which is the simplest form of nature, on residents’ understanding of several concepts used in the assessment of how humans relate with the natural ecological system. The green infrastructure consists of natural and semi-natural spaces like parks, gardens, green roofs, sports fields, streams, fountains, river banks, horticulture, community gardens, street trees, school yards and others (Dipeolu & Ibem, 2020; Jiang et al., 2018; Yu et al., 2019; Zijlema et al., 2020). The potential benefits of green infrastructure range from improving individuals’ health and well-being (Maes et al., 2015), strengthening social cohesion within the community (Kim et al., 2013), and providing environmental services like reducing urban heat islands, carbon sequestration, flood control, create a micro-climate and reconnecting fragmented natural environment (Ignatieva et al., 2010; Naumann et al., 2011; Venter et al., 2020).
In suggesting solutions to environmental challenges, different assessment parameters, scales and paradigms for assessing peoples’ concern and care for the environment have been put forward and empirically tested in different studies. Some of these include but not limited to a- the Maloney-Ward ecology inventory scale that measures knowledge, emotion and verbal and/or practical commitment; b-new environmental paradigm(NEP) scale that measures the extent to which people endorse the then-emerging worldview; (Dunlap & Van Liere, 1978) c- the ecological and human-centred scales for assessing the motivations of individuals to protect the natural environment because of its intrinsic values (Thompson et al., 1994) ; Thompson and Barton (1994) ; d- motivation toward the environment scale for measuring individuals rationale for engaging in environmentally-friendly behaviours (Pelletier et al., 1998); e- the scale that measures the level of connectedness and emotional feeling attached to natural environment (Mayer & Frantz, 2004) the integration-opposition scale used to measure the appreciation of human-nature interactions (Carrus et al., 2004) and f: the human-centred scales designed by Thompson et al. (1994) to assess individual value of nature-based on the materials or physical benefits it offers to man. Of specific interest to this study is environmental attitude measurement derived from the revised new ecological paradigm (NEP) scale by Dunlap et al. (2000), which among other things measures the magnitude of the approval human beings give to the ability of man to effectively manage the environment, the extent of industrial development within the environment’s carrying capacity, and the need to preserve and care for the environment. Although this scale has been used globally to assess environmental attitude in the literature as noted by previous authors (Dunlap, 2010; Hawcroft & Milfont, 2010), the extent to which the availability of green infrastructure in residential neighbourhoods could affect residents’ endorsement of the NEP scale is still grossly under-researched, especially in neighbourhoods in most Africa nations. This is probably because the existing literature seems to concentrate more on discovering the psychometric properties of the scale of measurement of the NEP without assessing its relationship with green infrastructure, especially in emphasising the variables common to developing nations.
Given this, it has become imperative for urban planners and managers to widen their search for specific strategies that can promote positive environmental attitudes by taking advantage of the green infrastructure facilities within the built environment. Thus, the need for this research in selected residential neighbourhoods in the Lagos metropolitan area of southwest Nigeria. This study specifically attempted to provide answers to three key research questions:
i.What are the perceptions of residents on the general characteristics of green infrastructure in Lagos Metropolis?
ii. To what extent has the availability of green infrastructure influenced the endorsement of the revised NEP scale by dwellers in Lagos Metropolis?
iii. Which characteristics of green infrastructure mostly influence the endorsement of the NEP by residents in the Lagos metropolitan area, Nigeria?
The research created a novelty in its potential to deepen our understanding of the capacity of green infrastructure in shaping the environmental attitude of the public in the area of study. In addition, by revealing the attributes of green infrastructure which mostly influence the endorsement of the NEP scale among the urban population in Lagos, the study findings are expected to inform urban planners and policymakers on the characteristics of green infrastructure that should be given priority attention in aiding urban residents to imbibe pro-environmental behaviours, which are vital in achieving sustainable urban environments in Nigeria and beyond.
2. Review of related literature
2.1 Urban Green Infrastructure
Several definitions and conceptions of green infrastructure are available in both research and policy literature. Many of these definitions and conceptions are based on professional and disciplinary perspectives. For example, whereas some authors viewed grasses, flowers and trees in the cities as green infrastructure because of their visual green components, others have referred to green infrastructure as specially designed structures such as water treatment facilities or allocated recreational spaces or buildings that are designed to be environmentally friendly. It has also been observed that people sometimes confuse the term “infrastructure,” and think of it as grey infrastructures like road kerbs and signposts, or infrastructural facilities like health centres, shopping malls, train stations or hotels (Bao, 2010). Facilities in this category are called built infrastructure and are distinct from green infrastructure (Beauchamp & Adamowski, 2013).
Further, Mell (2010) observed that the definitions of green infrastructure adopted by authors reflect their area of interest in green infrastructure research. For instance, recreational and landscape specialists usually focus on the benefits derived from contact with nature (Dipeolu et al., 2021; Frumkin et al., 2017; Jiang et al., 2018), and urban planners and managers are mostly attracted to the policy implementation aspect (Alaimo et al., 2016; Austin, 2014), while conservationists and ecological specialists tend to articulate the ecological and biodiversity components of green infrastructure (Benedict et al., 2012; Naumann et al., 2011). Although the definitions and components of urban green infrastructure may vary, green infrastructure is described as natural or semi-natural urban environments having a reasonable quantity of green spaces (Dipeolu et al., 2021; Wolch et al., 2014; Zhang et al., 2017).
Green infrastructure provides vital ecological services to the built environment, enhancing the functionality of the micro-climates and strengthening the quality of life of urban residents. Urban green infrastructure provides facilities and spaces for relaxation, socialisation and emotional connectivity to nature for individuals and families. Previous studies have argued that the most significant contribution of green infrastructure is the psychological well-being of individuals (Maes et al., 2015; Venter et al., 2020; Zhang et al., 2017). Other benefits associated with urban it includes an increase in worker productivity, reduction of stress and increase in motivation to undertake new challenges (Kim & Song, 2019; Zuniga-Teran et al., 2019). Additionally, green spaces have been linked to fostering social interactions, reducing the crime rate, and enhancing the social cohesion within the community (Arnberger & Eder, 2012; Cooper et al., 2014; Dipeolu et al., 2021; Santiago et al., 2015), reducing energy costs (Gómez-Muñoz et al., 2010), regulating ambient air temperatures, providing the opportunity for carbon sequestration and improving water and air quality (Barthel et al., 2013; Brantley et al., 2014). These benefits might help to explain why the importance of green infrastructure in the contemporary urban development and sustainability discourse cannot be over-emphasized.
2.2 The New Ecological Paradigm (NEP)
The idea of a new ecological paradigm (NEP) scale, originally known and described as the “new environmental paradigm,” was initially conceived by Dunlap and Van Liere in 1978 to evaluate the relationship between humans and nature, specifically on the belief that activities in the modern world were altering the ecological balance, the existing growth limit, and intensifying the human-centred attitude toward nature (Chaves, 2012; Dunlap, 2010). In general, NEP is hinged on the understanding that human relationships with nature should be handled with more care now than ever before. Therefore, individuals adapting the NEP philosophy see grave danger in the present condition of the earth; and thus, canvass the need to rethink how humans relate to the natural environment and curtail human activities within the carrying capacity of the ecological environment (Amburgey & Thoman, 2011). Approving these basic tenets of the NEP by an individual is a measure of the extent of concern about the environment in such an individual (Chaves, 2012; Erdogan, 2009). Therefore, the NEP scale has been seen as the most widely used among other several measures of environmental attitude among the public (Schultz et al., 2004).
The scale derived from the revised NEP has been adopted by different authors and researchers from various cultural backgrounds (Lee & Paik, 2011; Milfont & Duckitt, 2010). For example, in a study to measure environmental attitude among middle-income household heads in Cebu city of Philipines, it was discovered that respondents agreed that there were dangerous outcomes from the severe abuses the environment was being subjected to, and their NEP ratings indicated poor concern for the environment(Chaves, 2012). In another study in Arad, Romania, and Faro in Portugal, that sought to uncover the level of approval of the NEP by the residents using their demographic characteristics and the NEP scale, it was reported that people partially endorsed the NEP and that this was influenced by opportunities technology offers and the belief in the existence of unlimited resources. Also, in a related study to explore the degree to which 1295 undergraduates in four universities in Turkey were endorsing the NEP, Erdogan (2009) reported that about 56% of the respondents held pro-NEP views, while around 24.9% embraced the dominant social paradigm (DSP) views and 19.1% indicated ambivalent views. In a like manner, previous studies targeted at interest groups such as environmental organisations and other pro-environmental groups consistently found that environmentalists and other pro-environmental groups obtained better scores on the NEP compared to the laymen or the non-environmentalists (Dipeolu, 2017; Wiidegren, 1998)
Although, Dunlap et al. (2000) argued that some items in the NEP scale are an obsolete set of beliefs that indicate human perceptions of nature and the environment, several authors (Amburgey & Thoman, 2011; Hawcroft & Milfont, 2010; Kovács et al., 2014) also believe that the NEP consists a logical pattern of beliefs toward the environment and represents a criterion that predicts human behaviours. Howbeit Dunlap and Van Liere (1978) have noted that the NEP scale has established research validity among different groups, Thompson et al. (1994) insist that the findings of studies relating to perceptions of the NEP scale were the outcome of individual experiences, especially in natural environments. Nonetheless, despite the challenges of determining the behaviours and attitudes of humans as it relates to the natural environment, research has shown a strong link between the items in the NEP and some aspects of human behaviours, including self-reported and observed behaviours (Kovács et al., 2014; Milfont & Duckitt, 2010). Despite these, it is still not clear how these behaviours relate to the existence of green spaces in the built environment and how the quantity and quality of green infrastructure around residential environments can influence residents’ endorsement of the environmental attitude measurement under the NEP scale. These are the key issues the current study sought to address using survey data derived from residents of the rapidly growing city of Lagos, southwest Nigeria.
3. Research methods
3.1 Data and Sample
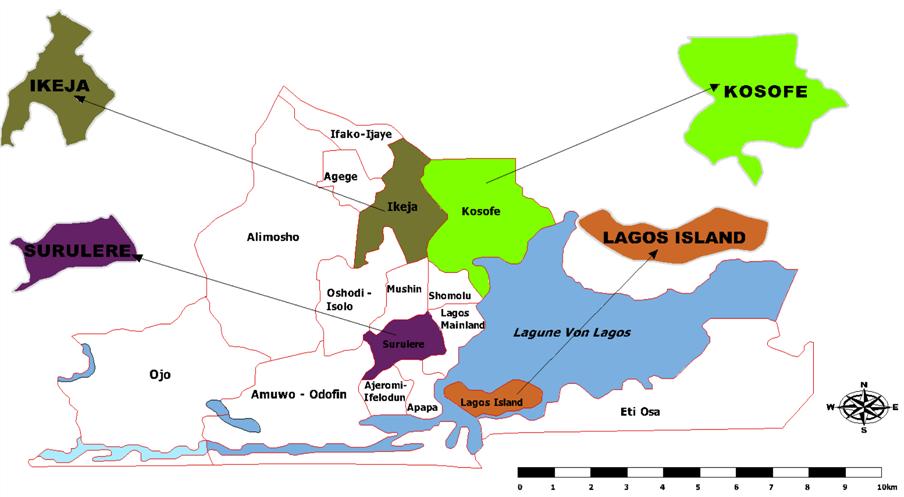
The study area for this research was four randomly sampled Local Government Areas (LGAs) in Lagos metropolitan area, namely; Surulere, Lagos Island, Kosofe and Ikeja, all of which make up one-quarter of the sixteen administration areas in the Lagos metropolitan area of the Lagos State southwest Nigeria (see Figure 1).
Considering the Beta (β)coefficients as presented in Table 4 in the ascending order of value, the small number of green areas in this neighbourhood having a beta coefficient of 0.254 is the most noticeable feature of green infrastructure that influenced residents’ endorsement of the NEP. This indicates that the size of available green spaces contributed most to explaining residents’ endorsement of the NEP scale in the study area. Closely follow is the existence of green areas for relaxation (β = 0.223), the closeness of a majority of the green areas to the people (β= 0.200), fast depletion of the green areas (β = 0.133), level of equipment of the green areas in the neighbourhoods (β =0.132), availability of parks in the neighbourhoods where children can freely play (β= 0.126) and others. These results mean that residents’ endorsement of the NEP scale will change by 0.254, 0.223, 0.200,0.133, 0.132 and 0.126 times for 1 unit addition in standard deviation in the number of green areas, the existence of green areas for relaxation, people stay close to a majority of green areas in the neighbourhood, reduction in the rate depletion of the green areas, level of equipment of the green areas and availability of parks in the neighbourhoods where children can freely play neighbourhoods, respectively.
5. Discussion of Findings
In this research, the influence of green infrastructure on residents’ endorsement of the new ecological paradigm was investigated. Overall, there are some key issues which have emerged that require further discussion. First, is the finding of how the residents felt about the general attributes/characteristics of green infrastructure in neighbourhoods sampled. Generally, the participants felt that the available green areas were relatively too small, being depleted at a very fast rate, not adequately equipped and thus were considered not to be in good condition. This shows that the residents felt that the green spaces in the residential neighbourhoods sampled were not enough both in quantity and quality. This implies that the current efforts by the Lagos State Parks and Gardens agency in upgrading the green areas in Lagos metropolitan area are yet to produce the desired results as expected by the people. Considering the evidence in the literature on the role of green areas in enhancing ecological balance (Kim et al., 2013; Zhang et al., 2017), promoting environmental sustainability (Dipeolu & Ibem, 2020), community attachment and social cohesion (Dipeolu et al., 2020), the perceived inadequacies of green spaces in the neighbourhoods can contribute to inhibiting the rate at which the residents can imbibe environmentally-friendly behaviours and denying the city of the several ecological benefits associated with green infrastructure, especially in the area of enhancing its capacity to cope with the challenges associated with climate change.
Secondly, regarding the extent to which the existence of green infrastructure has influenced the respondents’ endorsement of the NEP in the neighbourhoods sampled, the survey data also show that the participants believe that the quality of existing green infrastructure was generally poor, but the fact that it was available had a positive influence on their endorsement of the 15 different aspects of the NEP investigated. With each of the 15 items used to investigate endorsement of the NEP having a mean score above 4.01 (Table 3), it is obvious that the residents were certain that the existence of green infrastructure in the neighbourhoods contributed positively to their endorsement of the NEP. In support of previous studies (Liu et al., 2015; Wolch et al., 2014), the respondents generally agreed that green infrastructure can help to sustain and develop the earth’s natural resources, create habitats for plants and animals and balance the delicate nature of the earth. In addition, the results further revealed that the participants felt that the presence of green infrastructure in their surroundings contributed to enhancing the capacity of the natural environment to meet human needs; balance nature and the impacts of modern industries and also assist in resolving ecological crisis confronting humankind, especially, in town and cities. These are no doubt basic ecological benefits of green infrastructure that previous authors (Lee & Maheswaran, 2011; Ogunbode, 2013) had a link to the new ecological paradigm.
Lastly, this study also identified nine features of green infrastructure that influenced the participants’ endorsement of the NEP. Notably, the size of green spaces, the existence of green spaces for relaxation and the closeness of the green spaces to the residents, respectively, had the greatest positive influence, while the availability of green areas for relaxation in the neighbourhoods had the least influence on the endorsement of NEP. These results seem to provide support to the existing studies (Austin, 2014; Barthel et al., 2013; Benedict et al., 2012) linking green infrastructure and ecological benefits in urban neighbourhoods. Further, the discovery of the size of green spaces in the neighbourhoods as one of the leading factors influencing the participants’ endorsement of the NEP in this research is well-rooted in previous literature. In fact, according to Ignatieva et al. (2011), large green spaces promote biodiversity by providing habitat for plants and animals in the terrestrial and aquatic environment, especially in a place like Lagos State, Nigeria, which has a massive aquatic environment. In addition, several authors (Naumann et al., 2011) have also reported that the availability of green spaces helps residents to have a wider perspective of the functions of nature, including conservation, and social and environmental regeneration, especially in large cities like Lagos.
Similarly, the identification of the existence of green areas for relaxation as the next in the order of influence of green infrastructure characteristics on the residents’ endorsement of the NEP is also incongruent with the findings of previous studies (Dipeolu et al., 2021; Kim & Song, 2019; Mansor et al., 2012), indicating that green gardens in urban centres are made up of diverse components of green infrastructure, including street trees, fountains, open spaces, horticulture, urban forests, streams and other water bodies capable of providing the urban population with the opportunities to engage in social interactions and recreational activities in the natural environment. (Mansor et al., 2012) in particular observed that these categories of green infrastructure encourage city residents to engage in various activities such as relaxation, walking and other forms of mental and physical activities that promote mental and physical health and well-being. They are also known to provide the opportunity for people to gain access to nature, unlike the situation where green areas have been completely depleted and replaced with grey infrastructure and there is little or no access to elements of nature for recreation and leisure in towns and cities.
The result shows that the closeness of the green areas to the residents as the next green infrastructure feature with a high influence on residents’ endorsement of NEP was also expected. This is because the presence of green infrastructure in urban neighbourhoods has been linked with a positive influence on social interactions by previous studies (Dipeolu et al., 2021; Zhang et al., 2017). The existing studies have also confirmed that having access to green infrastructure, which is a function of the location of such elements of nature to close to the people can also engender regular contact with nature (Mansor et al., 2012) and that natural environments, such as gardens, parks, community forests, river views, fountains and open spaces have been reported to contribute greatly to improved health (Zijlema et al., 2020). Indeed, natural environments, have empirically been identified as avenues for promoting physical interactions, mental restoration and stress reduction (Markevych et al., 2017; Zhang et al., 2017). It was on this premise that Polat and Akay (2015) noted that the search for comfort in outdoor environments, in particular, was increasingly turning towards having contact with natural environments that green spaces offer to urban dwellers. For the residents of Lagos metropolis, Nigeria, having access to and living close to green infrastructure might mean that they do not need to go in search of green infrastructure and enjoy the benefits associated with adequate contact with nature and its restorative functions.
7. Conclusions and Recommendations
The findings of this study, which explored the influence of green infrastructure on the endorsement of the new ecological paradigm by residents of neighbourhood environments of Lagos metropolis in southwest Nigeria, have produced three major conclusions. The first conclusion is that the respondents in the study rated the quality of the green infrastructure in the studied neighbourhoods low. The second is that notwithstanding the perceived low quality of green infrastructure, the participants felt that the presence of this vital component of the built environment in their neighbourhoods had positively influenced their endorsement of the NEP. The last but not the least conclusion is that the three most important features of green infrastructure that significantly influenced the residents’ endorsement of the NEP are the size and existence of green areas for relaxation and the closeness of the green areas to the residents in the neighbourhoods.
There are notable implications from the findings of this study. First, the study implies that residents in Lagos metropolis are confronted with challenges relating to poor quality of green infrastructure; suggesting that they are yet to enjoy the full benefits associated with green infrastructure, which could have contributed to their level of manifestation of pro-environmental behaviours. To address this situation, the LASPARK, other public institutions and non-state actors responsible for urban development and management need to scale up their activities and programmes to ensure that more green infrastructure, including green spaces, gardens, recreational parks, sports fields and street trees among others are adequately provided and properly maintained in the residential neighbourhoods, towns and cities within and outside Nigeria. Among other benefits, this will help improve the quality and quantity of green infrastructure and reverse the growing trend in the depletion of this vital component of the ecosystem in urban areas. In addition, it is also suggested that when planning and developing public resources such as green infrastructure, the opinions and views of the residents regarding such facilities should be sought and incorporated into the process. Notably, this will help to minimize any form of inconsistency between the need and expectations of users and what urban managers are providing.
Second, the research approach employed suggests that this research has some limitations. For example, the data used were gathered basically through questionnaire administration, and this makes the results to be limited to the participants’ biases and moods, which are outside the control of the researchers. In addition, in terms of geographic scope, the survey was restricted to some selected neighbourhoods in the four Local Government Areas of Lagos metropolitan area; and as such the findings cannot be generalised to other residential neighbourhoods and LGAs in Lagos State, southwest Nigeria. To this end, future studies are required in other neighbourhoods and LGAs in this State and beyond. Finally, the regression analysis used in this research accounted for approximately 25% of the influence of green infrastructure on the endorsement of NEP. This implied that about 75% of the factors are not explained in this study. Therefore, other studies are recommended and such studies should include more variables to identify the remaining 75% of the predictors of urban population endorsement of the NEP.
Acknowledgements
The authors specially acknowledged the contributions of the Lagos State Government in approving this study (MOE/OES/7250/52) and also the residents of the study area for their voluntary participation.
Funding
This research did not receive any specific grant from funding agencies in the public, commercial, or not-for-profit sectors.
Conflicts of interest
The Author(s) declare(s) that there is no conflict of interest.
Data availability statement
The original contributions presented in the study are included in the article/supplementary material, further inquiries can be directed to the corresponding author/s.
Ethics statements
Studies involving animal subjects: No animal studies are presented in this manuscript.
Studies involving human subjects: No human studies are presented in this manuscript.
Inclusion of identifiable human data: No potentially identifiable human images or data is presented in this study.
CRediT author statement
Conceptualization: A.A, E.O. Data curation: A. A., O. A. Formal analysis: E.O., A.A. Investigation: O. A., A. A., E. O. Methodology: A.A., E.O., O.A. Project administration: O.A., A.A. Writing—original draft: E.O., A.A. Writing—review and editing: A.A., E.O., O.A. All authors have read and agreed to the published version of the manuscript.
References
Akpa, O. M., & Bamgboye, E. A. (2015). Correlates of the quality of life of adolescents in families affected by HIV/AIDS in Benue state, Nigeria. Vulnerable Children and Youth Studies, 10(3), 225-242. https://doi.org/10.1080/17450128.2015.1066914
Alaimo, K., Crawford, C., & Snyder, E. H. (2016). Harvesting Health in the Garden. In E. Hodges Snyder, K. McIvor, & S. Brown (Eds.), Sowing Seeds in the City: Human Dimensions (pp. 65-75). Springer Netherlands. https://doi.org/10.1007/978-94-017-7456-7_5
Amburgey, J. W., & Thoman, D. B. (2011). Dimensionality of the New Ecological Paradigm: Issues of Factor Structure and Measurement. Environment and Behavior, 44(2), 235-256. https://doi.org/10.1177/0013916511402064
Arnberger, A., & Eder, R. (2012). The influence of green space on community attachment of urban and suburban residents. Urban Forestry & Urban Greening, 11(1), 41-49. https://doi.org/10.1016/j.ufug.2011.11.003
Austin, G. (2014). Green Infrastructure for Landscape Planning: Integrating Human and Natural Systems. Routledge. https://doi.org/10.4324/9781315856780
Bao, L. (2010). Green infrastructure application in the Chelsea River Subwatershed 4.Amhearst: University of Massachusetts]. https://scholarworks.umass.edu/cgi/viewcontent.cgi?referer=&httpsredir=1&article=1003&context=larp_ms_projects
Barthel, S., Parker, J., & Ernstson, H. (2013). Food and Green Space in Cities: A Resilience Lens on Gardens and Urban Environmental Movements. Urban Studies, 52(7), 1321-1338. https://doi.org/10.1177/0042098012472744
Beauchamp, P., & Adamowski, J. (2013). An Integrated Framework for the Development of Green Infrastructure: A Literature Review. European Journal of Sustainable Development, 2(3), 1-24 https://doi.org/10.14207/EJSD.2013.V2N3P1
Benedict, M. A., McMahon, E. T., Fund, M. A. T. C., & Bergen, L. (2012). Green Infrastructure: Linking Landscapes and Communities. Island Press.
Brantley, H. L., Hagler, G. S. W., J. Deshmukh, P., & Baldauf, R. W. (2014). Field assessment of the effects of roadside vegetation on near-road black carbon and particulate matter. Science of The Total Environment, 468-469, 120-129. https://doi.org/10.1016/j.scitotenv.2013.08.001
Carrus, G., Passafaro, P., & Bonnes, M. (2004). Ambientalismo, autoritarismo ed etnocentrismo: Una scala di attegiamento verso il verde urbano. APA PsycNET. https://psycnet.apa.org/record/2004-18336-001
Chaves, M. G. F. (2012). New Ecological Paradigm: Testing the Environmental Concern Among Urban Middle Income Cebu City Household Heads. JPAIR Multidisciplinary Research Journal, 8(1), 38–57. https://doi.org/10.7719/jpair.v8i1.169
Cooper, C. H. V., Fone, D. L., & Chiaradia, A. J. F. (2014). Measuring the impact of spatial network layout on community social cohesion: a cross-sectional study. International Journal of Health Geographics, 13(1), 1–14. https://doi.org/10.1186/1476-072X-13-11
Dipeolu, A. A. (2017). Impact of green infrastructure on environmental sustainability in selected neighbourhoods of Lagos Metropolis, Nigeria. An unpublished PhD Thesis in the Department of Architecture, Federal University of Tech., Akure, Nigeria.
Dipeolu, A. A., & Ibem, E. O. (2020). Green infrastructure quality and environmental sustainability in residential neighbourhoods in Lagos, Nigeria. International Journal of Urban Sustainable Development, 12(3), 267-282. https://doi.org/10.1080/19463138.2020.1719500
Dipeolu, A. A., Ibem, E. O., & Fadamiro, J. A. (2020). Influence of green infrastructure on sense of community in residents of Lagos Metropolis, Nigeria. Journal of Human Behavior in the Social Environment, 30(6), 743-759. https://doi.org/10.1080/10911359.2020.1740853
Dipeolu, A. A., Ibem, E. O., Fadamiro, J. A., & Fadairo, G. (2021). Factors influencing residents’ attitude towards urban green infrastructure in Lagos Metropolis, Nigeria. Environment, Development and Sustainability, 23(4), 6192-6214. https://doi.org/10.1007/s10668-020-00868-x
Dunlap, R. E. (2010). The New Environmental Paradigm Scale: From Marginality to Worldwide Use. The Journal of Environmental Education, 40(1), 3-18. https://doi.org/10.3200/JOEE.40.1.3-18
Dunlap, R. E., & Van Liere, K. D. (1978). The “new environmental paradigm.” Journal of Environmental Education, 9(4), 10–19. https://doi.org/10.1080/00958964.1978.10801875
Dunlap, R. E., Van Liere, K. D., Mertig, A. G., & Jones, R. E. (2000). Measuring endorsement of the new ecological paradigm: A revised NEP scale. Journal of Social Issues, 56(3), 425–442. https://doi.org/10.1111/0022-4537.00176
Erdogan, N. (2009). Testing the new ecological paradigm scale: Turkish case. African Journal of Agricultural Research, 4(10), 1023-1031. https://academicjournals.org/journal/AJAR/article-full-text-pdf/40CFE5F35449
Frumkin, H., Bratman, G. N., Breslow, S. J., Cochran, B., Kahn Jr, P. H., Lawler, J. J., Levin, P. S., Tandon, P. S., Varanasi, U., & Wolf, K. L. (2017). Nature contact and human health: A research agenda. Environmental health perspectives, 125(7), 075001. https://doi.org/10.1289/EHP1663
Giusti, M., & Samuelsson, K. (2020). The regenerative compatibility: A synergy between healthy ecosystems, environmental attitudes, and restorative experiences. PloS one, 15(1), e0227311. https://doi.org/10.1371/journal.pone.0227311
Gómez-Muñoz, V. M., Porta-Gándara, M. A., & Fernández, J. L. (2010). Effect of tree shades in urban planning in hot-arid climatic regions. Landscape and Urban Planning, 94(3), 149-157. https://doi.org/10.1016/j.landurbplan.2009.09.002
Hawcroft, L. J., & Milfont, T. L. (2010). The use (and abuse) of the new environmental paradigm scale over the last 30 years: A meta-analysis. Journal of Environmental Psychology, 30(2), 143-158. https://doi.org/10.1016/j.jenvp.2009.10.003
Ignatieva, M., Stewart, G. H., & Meurk, C. (2011). Planning and design of ecological networks in urban areas. Landscape and Ecological Engineering, 7(1), 17-25. https://doi.org/10.1007/s11355-010-0143-y
Jiang, Y., Zevenbergen, C., & Ma, Y. (2018). Urban pluvial flooding and stormwater management: A contemporary review of China’s challenges and “sponge cities” strategy. Environmental Science & Policy, 80, 132-143. https://doi.org/10.1016/j.envsci.2017.11.016
Kim, D., & Song, S.-K. (2019). The Multifunctional Benefits of Green Infrastructure in Community Development: An Analytical Review Based on 447 Cases. Sustainability, 11(14), 3917. https://doi.org/10.3390/su11143917
Kim, E. S., Park, N., & Peterson, C. (2013). Perceived neighborhood social cohesion and stroke. Social Science & Medicine, 97, 49-55. https://doi.org/10.1016/j.socscimed.2013.08.001
Kovács, J., Pántya, J., Medvés, D., Hidegkuti, I., Heim, O., & Bursavich, J. B. (2014). Justifying environmentally significant behavior choices: An American-Hungarian cross-cultural comparison. Journal of Environmental Psychology, 37, 31-39. https://doi.org/10.1016/j.jenvp.2013.11.001
Lee, A. C. K., & Maheswaran, R. (2011). The health benefits of urban green spaces: a review of the evidence. Journal of Public Health, 33(2), 212-222. https://doi.org/10.1093/pubmed/fdq068
Lee, S., & Paik, H. S. (2011). Korean household waste management and recycling behavior. Building and Environment, 46(5), 1159-1166. https://doi.org/10.1016/j.buildenv.2010.12.005
Liu, W., Chen, W., & Peng, C. (2015). Influences of setting sizes and combination of green infrastructures on community’s stormwater runoff reduction. Ecological Modelling, 318, 236-244. https://doi.org/10.1016/j.ecolmodel.2014.11.007
Maes, J., Barbosa, A., Baranzelli, C., Zulian, G., Batista e Silva, F., Vandecasteele, I., Hiederer, R., Liquete, C., Paracchini, M. L., Mubareka, S., Jacobs-Crisioni, C., Castillo, C. P., & Lavalle, C. (2015). More green infrastructure is required to maintain ecosystem services under current trends in land-use change in Europe. Landscape Ecology, 30(3), 517-534. https://doi.org/10.1007/s10980-014-0083-2
Mansor, M., Said, I., & Mohamad, I. (2012). Experiential Contacts with Green Infrastructure's Diversity and Well-being of Urban Community. Procedia - Social and Behavioral Sciences, 49, 257-267. https://doi.org/10.1016/j.sbspro.2012.07.024
Markevych, I., Schoierer, J., Hartig, T., Chudnovsky, A., Hystad, P., Dzhambov, A. M., de Vries, S., Triguero-Mas, M., Brauer, M., Nieuwenhuijsen, M. J., Lupp, G., Richardson, E. A., Astell-Burt, T., Dimitrova, D., Feng, X., Sadeh, M., Standl, M., Heinrich, J., & Fuertes, E. (2017). Exploring pathways linking greenspace to health: Theoretical and methodological guidance. Environmental Research, 158, 301-317. https://doi.org/10.1016/j.envres.2017.06.028
Mayer, F. S., & Frantz, C. M. (2004). The connectedness to nature scale: A measure of individuals’ feeling in community with nature. Journal of Environmental Psychology, 24(4), 503-515. https://doi.org/10.1016/j.jenvp.2004.10.001
Mell, I. C. (2010). Newcastle University eTheses: Green infrastructure :concepts, perceptions and its use in spatial planning. Retrieved July 1, 2022, from https://theses.ncl.ac.uk/jspui/handle/10443/914
Milfont, T. L., & Duckitt, J. (2010). The environmental attitudes inventory: A valid and reliable measure to assess the structure of environmental attitudes. Journal of Environmental Psychology, 30(1), 80-94. https://doi.org/10.1016/j.jenvp.2009.09.001
Naumann, S., Davis, M., Kaphengst, T., Pieterse, M., & Rayment, M. (2011). Design, implementation and cost elements of Green Infrastructure projects. Final report, European Commission, Brussels, 138.
Ogunbode, C. A. (2013). The NEP scale: measuring ecological attitudes/worldviews in an African context. Environment, Development and Sustainability, 15(6), 1477-1494. https://doi.org/10.1007/s10668-013-9446-0
Pallant, J. (2020). SPSS survival manual: A step by step guide to data analysis using IBM SPSS. Routledge. https://doi.org/10.4324/9781003117452
Pelletier, L. G., Tuson, K. M., Green‐Demers, I., Noels, K., & Beaton, A. M. (1998). Why are you doing things for the environment? The motivation toward the environment scale (mtes) 1. Journal of applied social psychology, 28(5), 437-468. https://doi.org/10.1111/j.1559-1816.1998.tb01714.x
Polat, A. T., & Akay, A. (2015). Relationships between the visual preferences of urban recreation area users and various landscape design elements. Urban Forestry & Urban Greening, 14(3), 573-582. https://doi.org/10.1016/j.ufug.2015.05.009
Santiago, L., Gladkikh, T., Betancourt, L., & Vargas, Y. (2015). Green versus gray: attitudes toward vegetation in a tropical metropolitan square. Environment and Natural Resources Research, 5(2), 109-120. https://doi.org/10.5539/enrr.v5n2p109
Schultz, P. W., Shriver, C., Tabanico, J. J., & Khazian, A. M. (2004). Implicit connections with nature. Journal of Environmental Psychology, 24(1), 31-42. https://doi.org/10.1016/S0272-4944(03)00022-7
Shrestha, S. L. (2009). Categorical regression models with optimal scaling for predicting indoor air pollution concentrations inside kitchens in Nepalese households. Nepal Journal of Science and Technology, 10, 205-211. https://doi.org/10.3126/NJST.V10I0.2962
Steg, L., Bolderdijk, J. W., Keizer, K., & Perlaviciute, G. (2014). An Integrated Framework for Encouraging Pro-environmental Behaviour: The role of values, situational factors and goals. Journal of Environmental Psychology, 38, 104-115. https://doi.org/10.1016/j.jenvp.2014.01.002
Steg, L., & Vlek, C. (2009). Encouraging pro-environmental behaviour: An integrative review and research agenda. Journal of Environmental Psychology, 29(3), 309-317. https://doi.org/10.1016/j.jenvp.2008.10.004
Turner, A. G. (2003). Sampling strategies. Expert Group Meeting to review the draft handbook on designing of household sample surveys. Secretariat, Statistics Division. ESA/STAT/AC.93/2
Thompson, G., C., S., & Barton, M. A. (1994). Ecocentric and anthropocentric attitudes toward the environment. Journal of Environmental Psychology, 14(2), 149-157. https://doi.org/10.1016/S0272-4944(05)80168-9
Venter, Z. S., Krog, N. H., & Barton, D. N. (2020). Linking green infrastructure to urban heat and human health risk mitigation in Oslo, Norway. Science of The Total Environment, 709, 136193. https://doi.org/10.1016/j.scitotenv.2019.136193
Vlek, C., & Steg, L. (2007). Human Behavior and Environmental Sustainability: Problems, Driving Forces, and Research Topics. Journal of Social Issues, 63(1), 1-19. https://doi.org/10.1111/j.1540-4560.2007.00493.x
Wiidegren, Ö. (1998). The New Environmental Paradigm and Personal Norms. Environment and Behavior, 30(1), 75-100. https://doi.org/10.1177/0013916598301004
Wolch, J. R., Byrne, J., & Newell, J. P. (2014). Urban green space, public health, and environmental justice: The challenge of making cities ‘just green enough’. Landscape and Urban Planning, 125, 234-244. https://doi.org/10.1016/j.landurbplan.2014.01.017
Yu, Y., Xu, H., Wang, X., Wen, J., Du, S., Zhang, M., & Ke, Q. (2019). Residents’ Willingness to Participate in Green Infrastructure: Spatial Differences and Influence Factors in Shanghai, China. Sustainability, 11(19), 5396. https://doi.org/10.3390/su11195396
Zhang, Y., Van den Berg, A. E., Van Dijk, T., & Weitkamp, G. (2017). Quality over Quantity: Contribution of Urban Green Space to Neighborhood Satisfaction. International Journal of Environmental Research and Public Health, 14(5), 535. https://doi.org/10.3390/ijerph14050535
Zijlema, W. L., Triguero-Mas, M., Cirach, M., Gidlow, C., Kruize, H., Grazuleviciene, R., Nieuwenhuijsen, M. J., & Litt, J. S. (2020). Understanding correlates of neighborhood aesthetic ratings: A European-based Four City comparison. Urban Forestry & Urban Greening, 47, 126523. https://doi.org/10.1016/j.ufug.2019.126523
Zuniga-Teran, A. A., Staddon, C., de Vito, L., Gerlak, A. K., Ward, S., Schoeman, Y., Hart, A., & Booth, G. (2019). Challenges of mainstreaming green infrastructure in built environment professions. Journal of Environmental Planning and Management, 63(4), 710-732. https://doi.org/10.1080/09640568.2019.1605890
*Corresponding Author:
Department of Architecture, College of Engineering and Environmental Studies, Olabisi Onabanjo University, Ogun State, Nigeria .
Email address: dipeolu.adedotun@oouagoiwoye.edu.ng