How to Cite
Mortazavi, S., Tizhoosh, M., & Cheraghi, Z. (2017). Quality Evaluation and Study of Ecological Toxicity of Heavy Metals in Shadegan Wetland. Journal of Contemporary Urban Affairs, 1(3), 67-72. https://doi.org/10.25034/ijcua.2018.3683
Journal Of Contemporary Urban Affairs
2017, Volume 1, Number 3, pages 67– 72
Quality Evaluation and Study of Ecological Toxicity of
Heavy Metals in Shadegan Wetland
* Dr. Samar Mortazavi 1, Dr. Mohsen Tizhoosh 2, Dr. Zahra Cheraghi 3
1, 2, 3 Department of Environmental Science, Faculty of Natural Recourses and Environmental Science, Malayer University, Iran
1 E mail: mortazavi.s@gmail.com , 3 E mail: nejatsan@tums.sc.ir
*Corresponding Author:
Department of Environmental Science, Faculty of Natural Recourses and Environmental Science, Malayer University, Iran,
E-mail address: mortazavi.s@gmail.com
A R T I C L E I N F O:
Article history:
Received 2 August 2017
Accepted 10 August 2017
Available online 12 October 2017
Keywords:
Sediment quality;
Toxicity; heavy metals;
Shadegan wetland.
A B S T R A C T
Wetlands hold a principal position in storing food for primary producers, so they are not able to bear the pressure. The slightest disturbance, hence, may harm wetlands and cause detrimental effects. The present study aims at monitoring heavy metals and evaluation of the sediment quality index of Shadegan wetland in Iran. Thus, a sampling of surface sediments of the wetland was performed at ten stations with three replications; after the preparation of samples with aqua regia, the concentrations of heavy metals were measured by atomic absorption spectroscopy. The quantification of sediment pollution using the contamination factor, contamination degree, pollution load index, ecological risk assessment index, and ecological toxicity of heavy metals in the region were all carried out. The results of Cf and Cd showed that the degree of zinc and copper contamination is low; however, the degree of lead contamination is moderate. Moreover, the obtained PLI was less than 1 indicating a lack of sediments contamination with heavy metals. The RI was less than 150 indicating a low risk of contamination. In addition, comparing the concentrations of elements with National Oceanic and Atmospheric Administration and Sediment Quality Guidelines showed slightly toxic and non-toxic sediments, respectively. Finally, based on a mixture of effect range median, all sediment samples are placed in the first category with less than 12% toxicity probability.
JOURNAL OF CONTEMPORARY URBAN AFFAIRS (2017) 1(3), 66-72.
https://doi.org/10.25034/ijcua.2018.3683
www.ijcua.com
Copyright © 2017 Journal of Contemporary Urban Affairs. All rights reserved.
1. Introduction
Aquatic ecosystems, as one of the main environmental features, are a key supplier of food and a roof over aquatic organism’s head; on the other hand, they are also large sources for a wide range of pollutants. Since these ecosystems withstand a high capacity for development, they are subject to more serious risk due to the pollutants. Domestic and industrial sewage discharges, the growth in urbanization, and industrial activities in coastal areas are severe threats to the safety of the coastal environment and aquatic ecosystems. Among the existing pollutants in the sewage, heavy metals can be mentioned, especially the ones that play important roles in society as the main raw materials for many industries. (Zhuang and Gao, 2014; Caerio, et l, 2005) Some, such as copper and zinc, play a vital role in the metabolism of the human body. However, in high concentrations, they turn into toxic substances. Being attributable to high persistence toxicity, solubility low absorption and accumulation in the bottom sediments, heavy metals cause contamination in aquatic environments. (Caerio, et al., 2005) The biological toxicity and bio-magnification in food chains have made the issue of heavy metals a significant global problem. (Förstner and Wittmann, 1983) the ways to clean up contaminated sediment are mostly costly, and in some cases impossible. Hence, the evaluation of sediment contamination in the aquatic environment, identifying sources of pollution, applying management policies, and processes to reduce a number of pollutants into the aquatic environment is more important than focusing on clearing techniques.
Many studies have been done in this regard, among which the one carried out by Zarezadeh and Rezai, (2014) can be mentioned through which they have investigated the heavy metals in the sediments bed of mangroves Khurgabrik in Jack Port involving Molar coefficient, the degree of reformed contamination, and ecological risk assessment index. Vaezi et all, (2014) have investigated Mollar environmental index, pollution load, ecological toxicity in sediments in Mosa Firth, Persian Gulf. Chai et al., (2016) explored heavy metal pollution in river sediments in Serbia by calculating the pollution load index and ecological risk assessment. Chai and et al. Sakan and Dordevic, (2015) examined the index of enrichment, molar and ecological risk assessment in Xiangjiang River sediments. In the present study, the types of sediment geochemical index have been determined. Moreover, the ecological risks have been assessed, and ecological toxicity of sediments with heavy metals, namely lead, zinc and copper have been analyzed. The results have been compared with the standards of NOAA and SQG, respectively.
2. Materials and Methods
2.1Area of study
The Shadegan Wetland with an area of approximately 400,000 hectares in the range of coordinates 48 degrees 17 minutes and degrees 50 minutes east, 30 degrees 17 minutes 30 degrees and 58 minutes north is located in Khuzestan province, Iran, and has been recognized as an international wetland in the Ramsar Settlement in 1972. (Nasirian et al., 2015)
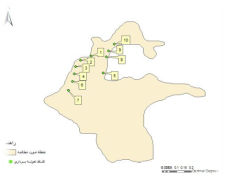
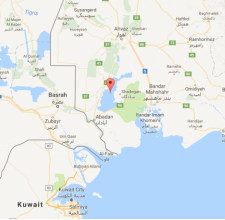
Figure 1. The location of the Shadegan wetland (left) [Source: Google map], and the locations of the sampling stations within the wetland (right).
2.2 Sampling and Preparing Samples
As per available access points, a sampling of surface sediments was carried in 10 stations with three replications and recording the geographic coordinates (table 1).
For the purpose of preparation, the sediment samples were dried in an oven at a temperature of 105° C. Then, they were crushed in a stone mortar and screened by a 63-micron sieve. For the acid ingestion of sediments, Direct Aqua Regia was employed, following the ingestion; with the contribution of double distilled water in a 25 mL volumetric flask, the volume was delivered. (Yap et al., 2012) To ensure the accuracy of ingestion and elimination of errors due to sample preparation and to undo the effect of consumed materials on the concentration of metals in each of ingestion operations, a control sample was considered; at the end of atomic absorption ContrAA700analyticjena, the concentration of metals in the samples was read. Detection limit for Cu, Pb and Zn in flame method was 0.23, 0.88 and 0.25 microgram per gram, respectively.
Table 1. Geographical coordinates of the sampling stations within Shadegan wetland.
|
|
Geographical Coordinates
|
Land use
|
|
74.1 E 4833
|
N 66.55 49 30
|
Road &Entrance of the village
|
|
34.25E 4832
|
N 32.3 3048
|
Rural residential area
|
|
18.57 E 4831
|
N 23.58 3045
|
Rural residential area
|
|
87.58E 4830
|
N 85.48 3043
|
Recreation area
|
|
83.11E 4835
|
N 99.38 3045
|
Recreation area
|
|
96.47 E 4839
|
N 12.5 3042
|
Recreation area
|
|
44.15E 4827
|
N 87.0 3041
|
Place& Pleasure Pier refueling
|
|
|
70.36E 4838
|
N 16.26 3048
|
Agricultural area
|
|
|
33.24 E 4840
|
N 16.22 3049
|
Agricultural area with an area of low
|
|
|
87.52E 4841
|
N 75.20 3050
|
Agricultural& Wastewater discharge
|
|
|
|
|
|
|
|
3. The Investigated Indices
Data geochemical description and choosing the sample ground play an important role in investigations. Many researchers have used the mean of cortical or frequency of data as a base. In the present study, to determine the extent of sediment contamination by heavy metals Shil Mean of Cu, Zn and Pb were 45, 95 and 20, respectively, which are presented by Turkian, and Wedephol, (1964) This index is a benchmark to measure pollution which is achieved by dividing the concentration of the elements to the same concentration of elements in the reference material (Shil average). it shows the amount of sediment contamination by heavy metals. The classification of Hakanson pollution index.(Hakanson,1980)  (Table 2).
3.1Cp Potential Pollution Index
Potential pollution index is obtained by dividing the maximum amount of each metal in the sediment on the average value of the same metal in the earth’s surface and is calculated as follows:
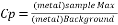 ,
,
where Cp <1 indicates a low pollution, 1≤CP <3 moderate pollution, and 3≤Cp severe pollution,Cd5 Pollution Degree Index. (Davaulter, and Rognerud, 2001).
Table 2. Different contamination factor (Cf) and factor (Cd), (Hakanson,1980)
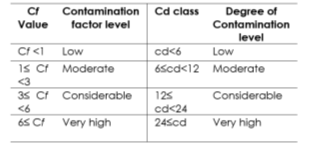
Total coefficients of pollutant contamination which are being studied show the overall degree of sediment contamination called Hakson pollution degree and is obtained from  (Table 2).
3.2 Pollution Load Index (PLI)
Tomlinson, pollution load index, has been the n-th root pollution load factor at one station from all the elements and is determined as  . If 1> PLI, it indicates a low concentration of heavy metals and the lack of pollution; PLI = 0 indicates the proximity of metal concentration to the background concentration, and PLI> 1 indicates contaminated sediment. (Varol, 2001)
3.3 Ecological Risk Assessment Index (RI)
For assessment of ecological risk index deposits in the aquatic environment, Hakansvn,(1980) presented  with
with  where Er is potential ecological risk for each element and RI is potential ecological risk of the total metals (cumulative). Hakanson's theory, (1980), Tr, is defined as the ratio of toxicity in this equation, for Pb, Zn and Cu is 5, 1, and 5, respectively (Table 3).
Table 3. Risk index levels and their effects.
|
Ecological risk criteria of environment
|
Risk index
|
|
Low
|
RI<150
|
|
Moderate
|
150≤R< 300
|
|
Considerable
|
300≤R<600
|
|
Very high
|
600≤R
|
3.4 Estimation of Ecotoxicology
Diverse amounts of pollutants affect the exposed organisms in different ways. In this regard, in some countries standards for pollutants have been proposed, among which America Standard Quality Sediment NOAA and Canada Guidelines quality sediments SQGS are the best-knowns, and the most widely used ones. The primary purpose of these standards is protecting the fish from the negative impact of organic and inorganic pollutants in sediments, grading and prioritizing contaminated areas for further investigation, and estimating the location of sediment pollution. Two sets of instructions that are commonly used include: Effect Range Low (ERL), Effect Range-Median (ERM), Probable Effect Level (PEl), and Threshold Effect Level (TEL). While the effect range low (ERL or TEL) shows the concentration below which there is no possibility of harmful effects, the major impact range (ERM or PEL) refers to the higher concentrations above which harmful effects and side effects of pollutants are likely to be observed. (MacDonald et al,2000; NOAA,2009) (Table 4).
Table 4. Sediment Quality Guidelines (US and Canada) based on standard values.
|
Standard
|
Index
|
Pb
|
Zn
|
Cu
|
Reference
|
|
NOAA
|
ERL
|
47
|
150
|
34
|
NOAA,2009
|
|
|
ERM
|
218
|
410
|
270
|
|
|
SQGS
|
TEL
|
35
|
123
|
70.35
|
Smith et al,1996
|
|
|
PEL
|
30.91
|
315
|
197
|
|
To obtain more realistic amounts of sediment toxicity effects in living organisms, the probable effective limit coefficient (PELQ) and the average effective limit coefficient (ERMQ) are calculated according to the following equations:
 and
and  .
.
Here Mi is concentrations in sediment I, PELi and ERMi: The possible effective concentration and average effective concentrations in sediment i, respectively. The variable n is the number of investigated metals in each instance. Correspondingly, the factors associated with the quantity of sediments are reported in Table 5. To calculate the amount of toxicity resulting from the mixture of a group of toxic elements, SQGS is calculated as follows (ERM: mid- effective range, Ci: concentration, N: the number of elements):
Table 5. The relationship between sediment toxicity value of ERMQ and PELQ and chance of sediment toxicity classification based on ERM. (Hwang et al ,2008)
|
Possibility of toxicity
|
m-ERM-Q
|
PELQ
|
ERMQ
|
Sediment toxicity
|
|
12%
|
<0.1
|
<1.0
|
<0.1
|
non toxic
|
|
30%
|
0.5-0.11
|
0.1-1.5
|
0.1-0.5
|
slightly toxic
|
|
40%
|
1/5-0.51
|
1.5-2.3
|
0.5-1.5
|
moderately toxic
|
|
74%
|
>1/5
|
>2.3
|
>1.5
|
heavily toxic
|
4. Results
The results of the concentration of zinc, copper and lead in surface sediment samples of Shadegan wetland (in micrograms per gram dry weight) are shown in the Figure 2. The potential contamination index (Cp) values of Pb, Zn and Cu are 1.209, 0.483 and 0.316, respectively.
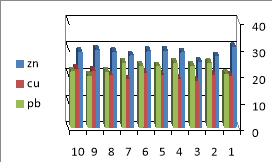
Figure 2. Average concentration of Zn, Cu and Pb in surface sediment Shadegan wetland (µg/g).
In order to determine the extent of contamination in the area Cf, Cd, mCd, PLI, RI and m-ERM- Q indices were calculated. The results are presented in Table 6. Ecological toxicity calculation results PELQ and ERMQ were 0.86 and 0.70, respectively, which are indicative of low toxicity and non-toxic sediments of the area in comparison to the studied elements. The results of the calculation of sediment contamination based on the of the ERM and the ERL indices are indicating that, in all the samples, concentrations of Pb, Cu and Zn are less than effective limit (<ERL). The calculated results of all the stations show that m-ERM-Q for the sediment samples exhibit 12% probability to contain toxicity probability.
5. Discussion and Conclusion
Investigating the mean concentrations of heavy metals in wetland sediments indicates that Zn> Pb> Cu. The mean concentration of Zn and Cu compared to the permissible concentration of these metals in a global average is lower, and the mean of lead is higher than the average global of the Earth’s crust. The cause of this can be the contamination of the sediments to these metals resulting from the discharge of industrial sewage at the sampling stations which is in line with the findings of Hatefi et al, (2016) and Mohammad Saleh et al, (2012) The Cp index results for 1<Pb<3 indicate that the average contamination in Shadegan wetland is in accordance with the results of Chandramohan studies. (Chandramohan, 2016) In this regard, Zn and Cu content is less than 1 which indicates their low pollution in the place.
As it was mentioned in the results section, the pollution index coefficient results (Cf) was less than 1 in all stations for copper and zinc. Hence, they are places in the first category with a low degree of contamination. The results of a lead pollutant index factor were those of average pollution in all stations except for the ninth station; this may be due to the practical usage of this station, which is a small agricultural area. The results are in line with the findings of Mohammad Saleh et al, (2012) and Hatefi et al,(2016) Moreover, based on the results obtained from pollution index factor (Cd), Zn and Cu are ranked first as the two low pollution factors; the Cd factor of lead holds the second rank and has an average pollution factor, a finding which is consistent with the reports of Gholam Dokht Bandari et al,(2015) The obtained mCd index for Zn, Cu, and Pb revealed that all these metal elements are of very low pollution factors; the findings on Zn are similar to those of Zarezadeh and Rezaei,(2014) the results of Cu and Pb are in line with numbers of Gholam Dokht Bandari and Rezaie,(2015) studies. The index rate of PLI of all the stations was less than 1 which is indicative of pollution-free nature of the sediments there; this is consistent with the results found by Chandramohan et al, (2016) and Mohammad Saleh et al, (2012). The ecological risk index shows that, in all stations, the numerical results were less than 150 and that the stations exhibited low ecological risks; this was in harmony with Zarehzadeh and Rezaei, (2000).
Compared with the existing standards of the U.S. and Canada, the results of the present study are representative of low- or non-toxic nature of the sediments for the living organisms in all the stations with low-toxic ratios. Lastly, according to the results of the sediments assessment indices, the prominent role of the destructions of heavy metals in threatening wildlife and the involvement of both human and natural factors on the distribution and concentration of heavy metals, as well as maintaining the balance of ecosystems, reviewing and monitoring the quality of the sediments are among the most important environmental considerations. It is paramount to identify the adverse effects of the pollutants on the environment as prerequisite for a proper management.
Acknowledgement
This research did not receive any specific grant from funding agencies in the public, commercial, or not-for-profit sectors.
References
Zhuang, W., Gao, X L. (2014). Integrated assessment of heavy metal pollution in the surface sediments of the Laizhou Bay and the coastal waters of the Zhangzi Island, China: comparison among typical marine sediment quality indices. PLoSOne, 9 (4),94-145.
Caeiro, S., Costa, M.H., Ramos, T.B., Fernandes, F., Silveira, N., Coimbra, A., Medeiros, G., Painho, M. (2005). Assessing heavy metal contamination in Sado Estuary sediment: an index analysis approach. Ecological Indicators, 5(2), 151–169.
Förstner, U., Wittmann, G.T. (1983). Metal Pollution in the Aquatic Environment, (2nd edition). Berlin, Germany: Springer.
Zarezadeh, A., Rezaee, P. (2014). Study on accumulation of heavy metals in mangrove sediments, Gabrik creek (Jask), Journal of Nature Environment ,69(1), 61-78.
Vaezi, A., karbasi, A., fakhrai, M., Valikhani samani, A., Heidari, M. (2014). Assessment of sources and contaminations in Marine sediments of Musa Estuary, Persian Gulf, Journal of Environment studies, 40(2), 345-360.
Chai, L., Li, H., Yang,Z ., Min, X,. Liao,Q., Liu,Y., Men,S., Yan,Y., Xu,J.(2016). Heavy metals and metalloids in the surface sedimentsof the Xiangjiang River, Hunan, China: distribution, contamination, and ecological risk assessment. EnvironSciPollut Res,24(1), 874–885.
Skins., Dordevic,D., (2015). Assessment of pollution with toxic elements in river, sediments by calculating facors of contamination and application of statistical methods. Naučno-stručničasopis SVAROG br,10, 316-329.
Nasirian, H., Alimohammadi, M., Kamandar, M., Saikhbarahwie, L., Mojadami Moghadam, H., Sheikhi,R. , Asgari, H., Hosseini, S.S., Farhani Ahmadi , F. (2015). water Quality Evaluation of the Shadegan and Hawralazim wetland from Iran. Indian J.sci.Res,6(2),11-24.
Yap, C.K., Ismail, A., Tan, S.G., Omar H. (2002). Concentrations of Cu and Pb in the offshore and intertidal sediments of the west coast of Peninsular Malaysia. Environment International, 28(6). 467–479.
Turkian, K.K., Wedephol, K.H. (1964). Distribution of the elements in some major units of the earth crust, Geol Soc Am Bull, 175-192.
Hakanson, L. (1980). “Ecological risk index for aquatic pollution control, a sedimentological approach”. Water Research, 14, 975–1001.
Davaulter, V., Rognerud, S. (2001). Heavy metal pollution in sediments of the Pasvik River drainage. Chemosphere, 42, 9-18.
Varol, M. (2001). Assessment of heavy metal contamination in sediment of the Tigris River (Turkey) using pollution indices and multivariate statistical techniques. Journal of Hazardous Materials, 195, 355-364.
MacDonald, D. D., Ingersoll, C. G., Berger, T. A. (2000). Development and evaluation of consensus-based sediment quality guidelines for freshwater ecosystems. Arch Environ Contam Toxicol, 39, 20–31.
NOAA (National Oceanic and Atmospheric Administration). (2009). SQUIRT, Screening Quick Reference Tables for in Sediment, W. 2005. Sediments in the catchment-coast continuum. J Soil Sediment, 5, 2-8.
Hwang, H. M., Green, P. G., Young, T. M. (2008). Tidal salt marsh sediment in California, USA: Part 3. Current and historic toxicity potential of contaminants and their bioaccumulation. Chemosphere, 71(11), 2139–2149.
Hatefi, R., Khezri, M., Khodaee, K., Shahsavari, A.A., Modaberi, S., Asadian, F. (2016). Geochemical modeling of environmental chemical pollutions rising from Granitoid Intrusions and mapping potentially hazardous areas: Ahar. Journal of Earth Science Researcher, 7(26), 1-20.
Mohammad Salah, E.A., Zaidan, T.A., Al-Rawi, A.S. (2012). Assessment of Heavy Metals Pollution in the Sediments of Euphrates River, Iraq. J. of Water Resource and Protection,4, 1009-1023.
Chandramohan, J., Chandrasekaran, A., Senthilkumar, G., Elango,G., Ravisankar, R.(2016). Heavy Metal Assessment in Sediment Samples Collected From Pattipulam to Dhevanampattinam along the East Coast of Tamil Nadu Using EDXRF Technique. Journal of Heavy Metal Toxicity and Disease,1(2),8.
Gholam Dokht Bandari, M., Rezaie, P. (2015). Study of some Heavy metal pollutions in the Hormuz Islands coastal sediments and Their origin. Journal of Oceanoghraghy, 6(22), 97-106.
Tizhoosh, M., Tizhoosh, H.R. (2016). The Concentration of Zinc, Lead, Cadmium and Copper in Raw Milk Production in Industrial Farms in Khorramabad, Iran. International Proceedings of Chemical, Biological and Environmental Engineering, 93, DOI: 10.7763/IPCBEE. 2016. V93. 16
How to Cite
Mortazavi, S., Tizhoosh, M., & Cheraghi, Z. (2017). Quality Evaluation and Study of Ecological Toxicity of Heavy Metals in Shadegan Wetland. Journal of Contemporary Urban Affairs, 1(3), 67-72. https://doi.org/10.25034/ijcua.2018.3683
This work is licensed under a Creative Commons Attribution - NonCommercial - NoDerivs 4.0.
"CC-BY-NC-ND"