|
|
Journal of Contemporary Urban Affairs
|
|
2022, Volume 6, Number 2, pages 193–205
Original scientific paper
A Proposal to Mitigate Energy Consumption through the Sustainable Design Process in Tunis
*1 Assoc. Prof. Safa Achour Younsi , 2 Dr. Athar Chabchoub ,
3 Dr. Nour El Houda Jouini , 4 Professor Fakher Kharrat
1, 2, 3 & 4 LaRPA, Carthage University, National School of architecture and urbanism, Tunis, Tunisia
1 E-mail: safa.achouryounsi@enau.ucar.tn , 2 E-mail: athar.chabchoub@enau.ucar.tn
3 E-mail: nourelhoudajouini@gmail.com , 4 E-mail: fakher.kharrat@enau.ucar.tn
|
|
ARTICLE INFO:
Received: 12 June 2022
Revised: 26 August 2022
Accepted: 5 September 2022
Available online: 18 September 2022
Keywords:
Energy consumption;
Thermal comfort;
Built environment;
Sustainable design process;
Urban design;
Numerical simulations.
|
ABSTRACT 
The main objective of this paper is to assess the energy efficiency of residential buildings in Tunis. To this end, three complementary studies were carried out at different levels. Initially, a diagnosis of the building’s adaptability to climate change at urban and architectural scales was established. The methodology adopted was based on indicators obtained following a cross-reference of environmental assessment tools. This made it possible to highlight the lacunary factors related to thermal comfort. According to this finding, the second research was set up to focus on outdoor thermal comfort. The methodology adopted is based on numerical simulations and calculations of comfort indices. The results demonstrated the importance of specific morphological indicators at the urban scale. Finally, the third research is interested in the architectural scale to assess the building’s thermal comfort and energy consumption. It was performed through numerical simulations. The results demonstrated the impact of specific physical indicators on buildings’ thermal comfort and energy behavior. Ultimately, this research highlighted the gap factors in urban and architectural design in Tunis. It detected the most significant physical and morphological indicators to be considered for sustainable urban design.
|
|
|
|
This article is an open-access article distributed under the terms and conditions of the Creative Commons Attribution 4.0 International (CC BY 4.0)

Publisher’s Note:
Journal of Contemporary Urban Affairs stays neutral with regard to jurisdictional claims in published maps and institutional affiliations.
|
|
JOURNAL OF CONTEMPORARY URBAN AFFAIRS (2022), 6(2), 193-205.
https://doi.org/10.25034/ijcua.2022.v6n2-6
www.ijcua.com
Copyright © 2022 by Achour-Younsi, S., Chabchoub, A., Jouini, N. E. H., Kharrat, F.
|
|
|
|
1 . Introduction
The climate writes the history of peoples and civilizations, it influences our way of being, our way of life, our cities, and our homes (Song & Ye, C., 2017). Men have always been in harmony with their climate and ecosystem until the industrial revolution when this balance was broken, and nature was challenged (Goudie, 2018). The population explosion and pollution have caused unprecedented global warming. Indeed, during this decade, all countries recorded exceptionally high temperatures never experienced before (Carter, et al., 2015) This global warming is increasingly felt and threatens the environment in various aspects: depletion of energy, food, hydraulic resources, and pollution (Viguié, 2020; Wang, Chen, & Ren, 2011). In August 2021, the Intergovernmental Panel on Climate Change published a report focusing on the state of emergency and the increased risk of climate change in the Mediterranean region. Indeed, this region is considered a hot spot for climate change due to its many vulnerability factors (Climate Change , 2022). Thus, Mediterranean cities are heavily impacted by this climate change, and it is time to make the necessary decisions to preserve them. These agglomerations are not only the critical centers of energy consumption but also the most important centers of decision-making and the creation of adaptive solutions. It will thus be necessary to implement all the efforts to control energy consumption to adapt as much as possible to the current circumstances.
Tunisia, a country in the south of the Mediterranean basin, is classified as an ecological debtor. The United Nations ranks it among the 15 African countries most vulnerable to climate change (UNEP, 2018). The situation is alarming because the annual temperature will increase by about 2.1 °C and could reach +3.5 °C in 2050. It has also increased the number of heatwave days and extreme precipitation events (M.A.L.E, 2020). Therefore, Tunis, the capital, does not escape the problem of cities, which is to try to control its energy consumption. And like any city, the most energy-intensive sector turns out to be buildings. Thus, the real estate sector represented 36% of total energy and 39% of energy consumption and process-related emissions in 2017 (UNEP, 2018). It then seems essential for us, as designers, to rethink our designs, whether on an urban or architectural scale, in a more resilient way to limit the energy consumption associated with buildings. Unfortunately, the usage of air conditioning systems to enhance the thermal quality of places is mostly to blame (Degelman, 2002). These air conditioning devices release anthropogenic energy which, in turn, raises temperatures at street level (Girgis, Elariane, & Abd Elrazik , 2016). We are therefore facing an infinite loop, a vicious circle that it is important to break to help enhance the standard of living in our cities.
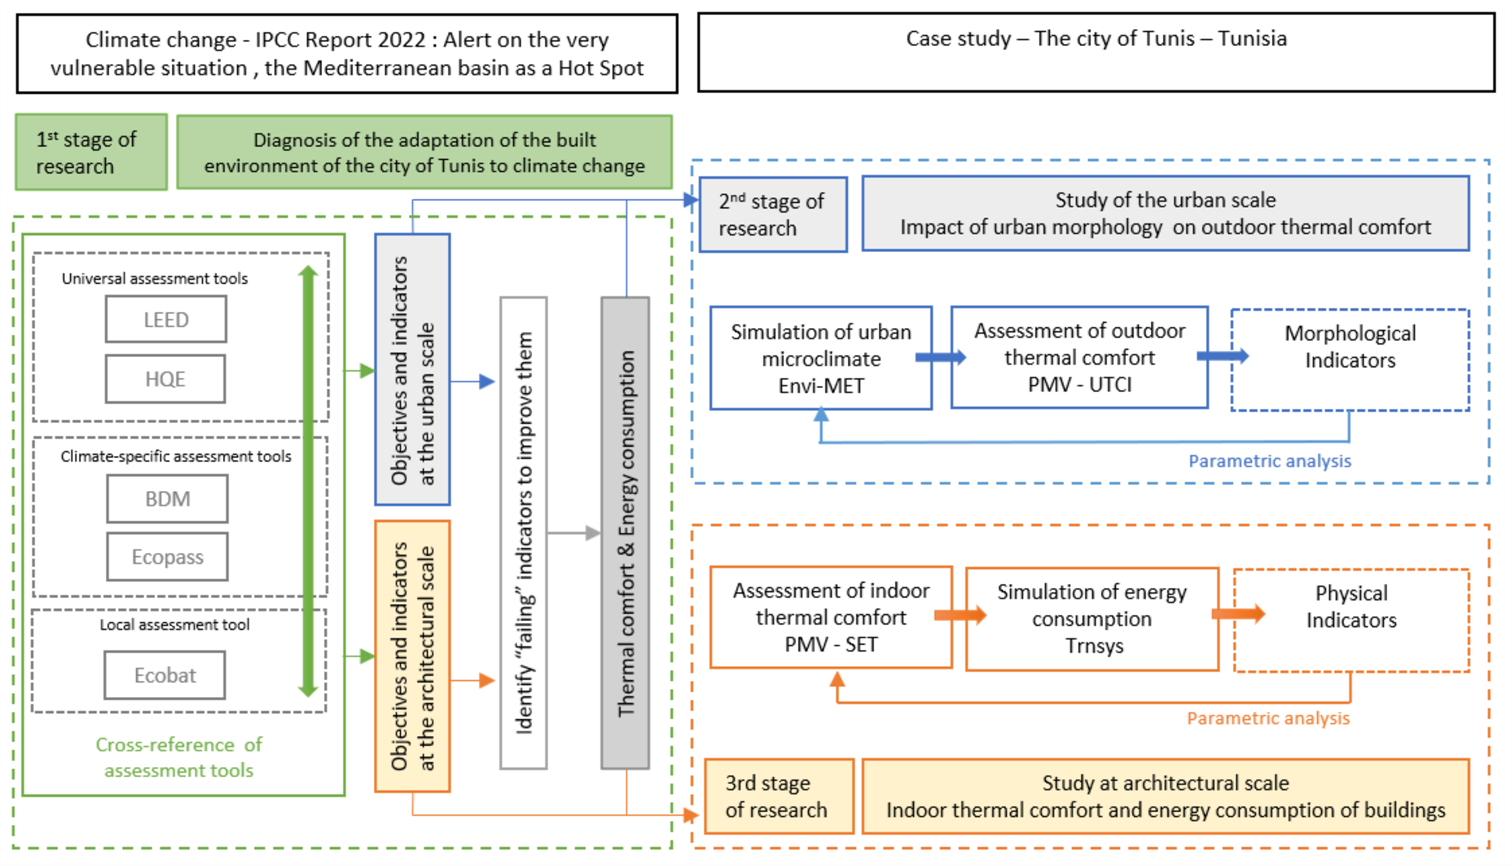
In this article, three complementary research works are presented. They tend toward the same objective: the mitigation of energy consumption, and this, through the highlighting of the levers of action at the urban and architectural scale. The research process, explained in Figure 1, follows three stages. The first stage of this study focuses on the environmental diagnosis which targets urban design and architectural conception. The main objective is to identify the deficient factors and the actors concerned according to the environmental diagnosis. Based on the results of the most lacunary factors, the second step is to deepen the outdoor thermal comfort at the urban scale. It studies the influence of urban morphology on outdoor thermal comfort conditions. Finally, the third stage is interested in the architectural scale, by assessing indoor thermal comfort and how it affects a building's energy use.
2 . Materials and Methods
Since the main objective of this study is to evaluate the energy efficiency of buildings in Tunis, the methodology adopted begins with a diagnosis of the adaptability of buildings to climate change in the city, based on a mix of environmental assessment tools on the urban and architectural scales. This diagnosis identifies the most deficient factors that need to be treated. Then, the second stage deepens the urban scale by studying the impact of urban morphology on outdoor thermal comfort. Finally, the last phase focuses on the architectural scale in more detail by studying thermal comfort and its effect on the energy consumption of buildings. These last two steps are based on two analyses, a first comparative followed by a parametric one. They are performed via numerical simulations, calculating different indices of thermal comfort and energy consumption. In the following sections, the three steps are explained in detail.
2.1 Methodology for a diagnosis of the environmental quality of neighborhoods and buildings in Tunis
In the environmental studies of the cities, three scales are studied: the territory, the district, and the building. It should be noted that the interlocking of the scales is essential. The methodology adopted in this step is a multi-criteria approach. It aims to diagnose environmental quality at the urban level of the neighborhood and the architectural level.
The methodology was developed using five global environmental assessment tools:
• Two “universal” assessment tools: LEED (Matisoff, Noonan, & Mazzolini, 2014) and HQE (Madec, 2002)
• Two climate and region-specific assessment tools, BDM (Envirobat, 2012) and ECO PASS (Gauzin-Müller, 2009)
• One local assessment tool under development ECOBAT (A.N.M.E, 2005)
Cross-checking allowed it to retain the objectives present in at least three tools. These objectives are consistent with the mitigation and adaptation measures of the national strategy.
Furthermore, two types of indicators are distinguished:
• Qualitative indicators that will be assessed on two to three scales (yes, few, no)
• Quantitative indicators that will be calculated using mathematical formulas and reference values. Citizen surveys and numerical simulations on Revit Architecture with the Insight 360° Plugin will also be used.
2.1.1 Case study applied to the diagnosis
This study is interested in collective housing in Tunis. To do this, a representative sample of five residential complexes was chosen: The Ennour - Jaafer residence, The Pin-Lac II residence, The Omrane - El Ghazela residence, and the two Palmeraie - Aouina residences. The choice was made so that there is a varied sample to have buildings of different standings and from public and private developers.
2.1.2 Environmental diagnosis at the urban scale of the district
This section presents the objectives selected from cross-referencing of assessment tools and their respective indicators in the following table. They will serve as an analysis grid for the corpus cited above.
Table 1. Objectives of the urban scale diagnosis.
|
|
Objectives and Indicators
|
Type of Indicator
|
Analysis tool
|
|
1
|
Preliminary studies
|
Qualitative
|
Two-scale assessment (yes/no)
|
|
2.
|
Context of the site and integration into the natural and urban environment
|
Qualitative
|
Two-scale assessment (yes/no)
|
|
3.
|
Ecological continuity and preservation of plant cover
|
|
Respect for the topography of the land and reuse of excavated soil
|
Qualitative
|
Two-scale assessment (yes/no)
|
|
Increase in Plant Density
|
Quantitative
|
Calculation of Plant Density
|
|
Increased plant density of roofs
|
Quantitative
|
Calculation of Roof Plant Density
|
|
Plantations of local species
|
Qualitative
|
Two-scale assessment (yes/no)
|
|
4.
|
Preservation of water resources and stormwater management
|
|
Increased soil permeability rate
|
Quantitative
|
Calculation of permeability rate
|
|
Stormwater collection and reuse system
|
Qualitative
|
Two-scale assessment (yes/no)
|
|
5.
|
Reduced car trips
|
|
Connection to public transport within 1 km
|
Qualitative
|
Three-scale assessment (yes/few/no)
|
|
Vehicle parking
|
Qualitative
|
Two-scale assessment (yes/no)
|
|
Soft transport modes (cycle paths and pedestrian streets)
|
Qualitative
|
Three-scale assessment (yes/few/no)
|
|
Functional diversity within a perimeter of 1Km
|
Qualitative
|
Three-scale assessment (yes/few/no)
|
|
6.
|
Limitation of urban sprawl and optimization of solar gains
|
|
Optimization of built urban density
|
Quantitative
|
Calculation of urban density
|
|
Optimization of urban roughness
|
Quantitative
|
Calculation of urban roughness
|
|
Optimization of solar gains through the envelope and shading of facades and streets
|
Qualitative
|
Numerical simulation of shading and average cumulative insolation
|
|
|
|
|
|
2.1.3 Environmental diagnosis at the architectural scale
The objectives and indicators are summarized in the following table by going to the architectural scale, and by the same crossing of tools. They serve as a grid of analysis on the buildings of the corpus.
Table 2. Objectives of the architectural scale diagnosis.
|
|
Objectives and Indicators
|
Type of Indicator
|
Analysis tool
|
|
1.
|
Preliminary architectural and thermal studies
|
|
Architectural studies
|
Qualitative
|
Two-scale assessment (yes/no)
|
|
Thermal studies
|
Qualitative
|
Two-scale assessment (yes/no)
|
|
2.
|
Propose a bioclimatic architecture
|
|
|
Optimize solar gains by envelope, shape, and orientation of the building
|
Qualitative
|
Two-scale assessment (yes/no)
|
|
|
Reduce heat loss by increasing the compactness of the building
|
Quantitative
|
Form Factor Calculation
|
|
|
Optimize the size and orientation of glass openings
|
Quantitative
|
Calculation of overall bay window rates (%) and relative bay window rates (%)
|
|
|
Prioritize natural ventilation
|
Qualitative
|
Two-scale assessment (yes/no)
|
|
3.
|
Optimize the thermal quality of the envelope
|
Quantitative
|
thermal resistance R
transmission coefficient U
phase shift D
|
|
4.
|
Use construction materials with a high environmental index
|
Quantitative
|
environmental index of materials (high, medium, low)
|
|
5.
|
Reducing the use of fossil fuels
|
|
|
Give preference to types of renewable heating, air conditioning, and domestic hot water systems
|
Qualitative
|
Two-scale assessment (yes/no)
|
|
|
Use energy monitoring equipment
|
Qualitative
|
Two-scale assessment (yes/no)
|
|
6.
|
Building resistance to climatic conditions and maintenance
|
Qualitative
|
Two-scale assessment (yes/no)
|
|
7.
|
Water management by shut-off valves and economical equipment
|
Qualitative
|
Two-scale assessment (yes/no)
|
|
|
|
|
|
2.2 Methodology for the assessment of outdoor thermal comfort conditions in the city of Tunis
This second stage of the study focused on the urban scale regarding outdoor thermal comfort, which is the primary impact of the Urban Heat Island effect (UHI). To do this, it is first necessary to study the impact of urban morphology on the urban microclimate (Jin, Cui, Wong, & Ignatius , 2018; Jansen, Martinez, & Devillers, 2021). Then, through the urban microclimate data, the outdoor thermal comfort can be assessed. Concerning the urban morphology component, this study is done on two levels, for each of them, the indicators which have been deemed to be the most influential on the urban microclimate according to the research of (Ait-Ameur, 2002) are listed below:
-At the district level:
-
Built density
-
Urban roughness
-
Plant density
-
Urban porosity
-At street level
-
Ratio Height to Width of streets H/W
-
Sky View Factor SVF
-
Albedo
2.2.1 Case study of the outdoor thermal comfort
This study conducted a comparative analysis of the three fabrics representative of the city of Tunis. The first one is a fabric from the Medina of Tunis, with a dense fabric composed of houses with patios assembled in clusters and thus generating narrow and sinuous streets. The second one is a sample of the European colonial fabric characterized by an orthogonal grid and buildings aligned with equal heights. And finally, the third one is a regulated fabric that is part of a subdivision governed by urban rules, specifications, and imposed withdrawals. This differentiation of fabrics will allow us to highlight the adaptation of new fabrics to climate change essentially on outdoor thermal comfort.
2.2.2 Comparative analysis of the fabrics
This first analysis aims to compare the outdoor thermal comfort conditions in the different fabrics of Tunis over time. Thus, to begin with, it was first necessary to carry out an in-situ measurement campaign to identify the microclimatic parameters involved in the evaluation of outdoor thermal comfort, namely, the air temperature (Ta), Mean Radiant Temperature (Tmrt), relative humidity (RH) and wind speed (Va).
Then, a numerical simulation via the Envi-met model (v4.0) (Hutner & Bruse , 2009) was carried out to obtain the microclimatic data on the duration necessary for the analysis. The data thus obtained were compared with those measured to verify the correct parameterization of the simulation. Furthermore, statistical validation was done. Finally, the output data allowed us to calculate the comfort indices PMV: Predicted Mean Vote (A.F.N.O.R, 1995) and the UTCI: Universal Thermal Climate Index (Bröde , et al., 2013).
2.2.3 Parametric analysis of morphological indicators
After carrying out this first analysis, which allowed a first reading of the results, and to confirm them, a parametric analysis was performed, in which a single indicator was modified each time. This allowed verifying the influence of each indicator on outdoor thermal comfort.
2.3 Methodology for the assessment of indoor thermal comfort in collective buildings and their energy consumption
This third stage of the research, which is closely related to the previous one because of the effect of the Urban Heat Island (UHI) on the quality of life inside buildings, attempts to assess the degree of adaptation of the contemporary “new” building to the climate. The methodological approach is based on several analytical techniques resulting in a specific protocol. This is deployed on two approaches: the first comparative and the second parametric.
2.3.1 Study case of collective buildings
The research step is interested in downtown Tunis which has undergone many changes. Indeed, local authorities tend to demolish dilapidated colonial buildings and replace them with contemporary ones. Thus, the current urban landscape of the city center is composed of a mix of colonial and contemporary buildings. The study compares the adaptation of this new building to climate change. The corpus of study then contains four buildings; two colonial and two contemporaries located in the Lafayette district of Tunis.
2.3.2 Comparative study of colonial and contemporary buildings
This stage compared the interior spaces’ thermal quality and the buildings’ energy behaviour. A measurement campaign of the parameters involved in evaluating indoor thermal comfort was done. Then, a numerical simulation on the TNSYS model (version 16) was carried out.
To deal with the physical aspect of thermal comfort, the buildings were studied according to the two analytical indices of thermal comfort: PMV: Predicted Mean Vote and SET: Standard Effective Temperature (Ye, Yang , Chen, & Li , 2003). First, the PMV index was calculated using the numerical simulation on the TNSYS model (Magnier & Haghighat, 2010). Then, for the SET index, the results collected from the numerical simulation were entered into the calculation tool (CBE Thermal Comfort Tool) to calculate the SET comfort index and validate the PMV results given by TRNSYS.
To deal with the energy component, the study’s results were based on adaptive comfort in Tunis, undertaken by (Bouden & Ghrab , 2005) . From the two formulas, relating to the calculation of the comfort temperature (TC-Griffiths and TC-Brager), proposed by Bouden and Ghrab and adapted to Tunisian conditions, the comfort temperature was calculated from that based on TC-Brager since it is the most suitable for high outdoor temperatures. Then, this temperature was entered in TRNSYS as the setpoint temperature so that the software could simulate the energy needed by the buildings studied to reach it.
2.3.3 Parametric analysis of physical indicators
Intending to propose the outline of a design adapted to the climate of Tunis, an experimental study on one of the two contemporary buildings studied was conducted.
To this end, it was first necessary to recognize and identify the physical architectural variables that could influence indoor thermal comfort and energy consumption. Then, new numerical simulations were performed, assigning the characteristics of colonial buildings to one of the contemporary buildings. Next, the intervention concerned the envelope composition by studying four envelope scenarios (Mourid , El Alami , & Kuznik, 2018) Then, the impact of the addition of solar protection on thermal and energy levels was studied. There were also changes affecting the glazing rate and type. For the last parameter, the contemporary building studied was manipulated by changing its orientation according to the four cardinal points each time.
3 Main Results
3.1 Diagnosis of the city of Tunis: a need to rethink the design of cities at all stages of the process
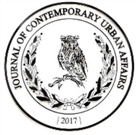
At the end of the diagnosis of the residential complexes, the results demonstrated that, their environmental potential remains low despite some differences, especially at the urban scale. To interpret the results, a rating system was created. The scoring system assessed the indicators and classified the objectives into four categories: achieved, partially achieved, flawed, and missing.
It has been deduced that the collective complexes of Tunis are not very respectful of the environment and are therefore very vulnerable to the present and future effects of climate change. Indeed, overall, 100% of the collective complexes analyzed have a rating below the average, 50% have a rating below the average for the urban scale and 75% have a rating below the average for the architectural scale.
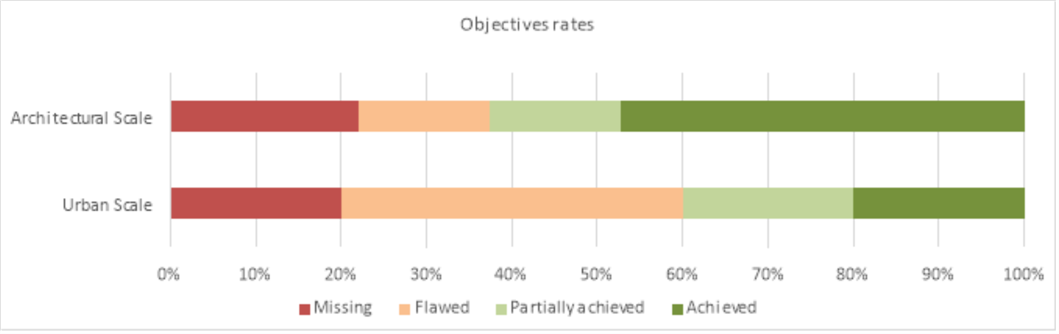
Figure 2. Objectives rates of the environmental diagnosis of the city of Tunis.
These results were mainly used to detect deficiencies or missing factors.
Thus, at the urban level of the district, which turns out to be the most lacking, the missing objectives are:
-Stormwater management
-Urban morphology
For the architectural component of the building, the most flawed objectives are:
-The thermal study
-Bioclimatic architecture
-Building materials
This study has also shown that adaptation goes through all the stages from the studies to the exploitation and requires the intervention and the awareness of all the actors of the building and even the user. Only by working together will it be feasible to redesign the built environment to accommodate both the immediate and long-term implications of global warming.
Action levers have therefore been identified and summarized in the table below.
Table 3. Proposals for possible improvements throughout the sustainable design process In Tunis.
|
Stage
|
Actors
|
Action levers
|
|
Urban Planning
|
Authorities
Architects
Urban planners
Engineers
Industrial
|
- Improve the transport network
- Avoid the isolated housing type and limit urban sprawl
- Thermal study on an urban scale
- Rethinking construction and materials
|
|
District Planning
|
A public or private developer
|
- Provide interior courtyards
- Increase the revegetation of floors and roofs
- Reduce asphalt and provide pedestrian streets and cycle paths
- Provide a water management system
|
|
Building Architecture
|
Real estate developer
Architect
|
- Use bioclimatic architecture
- Prioritize sun protection
- Consider the orientation and reduce the openings
- Integrate renewable energies
- Improve the quality of the envelope
|
|
Exploitation
|
Users
|
- Awareness of the use of active systems of air conditioning
- Choose energy-efficient equipment
|
3.2 Assessment of outdoor thermal comfort in Tunis: towards an urban morphology based on canyons-type streets
The results of the physical aspect of thermal comfort allowed us to classify the different fabrics according to their degree of adaptation to climate change, through the thermal comfort indices UTCI and PMV, as well as the percentage of comfort zones over a day. Furthermore, the results show the morphological characteristics of the medial fabric classify it as being the best thermally, followed by the regulated one and to finish the colonial fabric.
Table 4. Thermal classification of urban fabrics studied.
|
|
|
Medina fabric
|
Regulated fabric
|
Colonial fabric
|
|
Indicators at the Neighborhood scale
|
Built Density
|
0.71
|
0.19
|
0.49
|
|
Plant Density
|
0.03
|
0.22
|
0.03
|
|
Urban Porosity
|
0.03
|
0.08
|
0.05
|
|
Urban Roughness (m)
|
6.87
|
2.48
|
9.8
|
|
Indicators at street level
|
H/W average
|
3,51
|
0,49
|
1,59
|
|
SVF average
|
0,16
|
0,49
|
0,20
|
|
Albedo average
|
0,54
|
0,32
|
0,38
|
|
Outdoor thermal comfort
|
Percentage of comfort zones
|
61
|
58
|
53
|
|
UTCI average (°C)
|
23.50 Comfortable
|
26.58 Moderate heat stress
|
30.06
High heat stress
|
|
PMV average
|
0,8 Comfortable
|
1,6 Slightly warm
|
2,7
Warm
|
Then, the study looked for correlations with morphological indicators to better understand these differences in outdoor thermal comfort, by carrying out new parametric simulations on the Envi-met model. To confirm the first readings, and at the end of the parametric analysis, it has been possible to identify the following results.
Table 5. Correlations between morphological indicators and outdoor thermal comfort components.
|
Scale of analysis
|
Neighborhood level
|
Street-level
|
|
Morphological indicators
|
Built Density
|
Urban Roughness
|
Urban Porosity
|
Plant Density
|
Ratio H/W
|
SVF
|
Albedo
|
|
Outdoor Thermal Comfort
|
+++
|
+
|
+
|
++++
|
++++
|
++++
|
++
|
|
|
Solar radiation
|
+++
|
|
|
+++
|
+++
|
+++
|
|
|
Ta
|
++
|
|
+
|
+
|
+++
|
+++
|
|
|
Tmrt
|
|
|
|
|
|
|
++++
|
|
HR
|
|
|
|
+++
|
|
|
|
|
Va
|
++
|
+++
|
++
|
+
|
+
|
+
|
|
|
++++
+++
|
High impact
Significant impact
|
|
|
|
|
|
|
|
|
++
|
Moderate impact
|
|
|
|
|
|
|
|
|
+
|
Low impact
|
|
|
|
|
|
|
|
|
|
No apparent impact
|
|
|
|
|
|
|
|
|
|
|
|
|
|
|
|
|
|
|
|
3.3 Assessment of the thermal quality of indoor spaces: a deterioration of the situation for new buildings
At the end of the analysis, the findings concerning the PMV index demonstrated a clear distinction between colonial and modern structures. This difference favors colonial buildings. The results relating to the SET index, also show a considerable difference (3°C at 6 pm) between the two types of buildings.
Figure 3. Comparison between thermal comfort in colonial and contemporary buildings.
Energetically, the numerical simulation results show that the colonial buildings consume 1902.40 kWh, during August 2018, half less than their contemporary’s counterparts (which consume 4351.36 kWh).
At the end of this comparative study, the results clearly show differences between the two types of buildings studied. Whether thermally or energetically, colonial buildings are widely favored. Indeed, contemporary buildings of the colonial fabric of Tunis display a thermal failure explaining their energy-consuming side. This is probably due to the very high level of glazed surfaces present in contemporary buildings (compared to colonial buildings which have 25% less glazing) regardless of the orientation of the facade. Indeed, these glazed surfaces being in direct relation with the outside, and without the presence of any kind of sun protection, certainly cause overheating inside the building and discomfort due to direct sunlight thus decreasing the thermal quality of contemporary buildings, thus increasing their energy bill (by excessive use of cooling systems).
The following results were obtained in a second step, and after carrying out the experimental analysis, in which simulations were performed by changing each parameter.
Table 6. Results of the parametric analysis and the impact of each physical indicator.
|
|
PMV
|
Number of hours in Hot zones of PMV
|
SET (°C)
|
Number of hours in Hot/ Unacceptable zones of SET
|
Energy Consumption (KW.H)
|
|
Original situation
|
1,59
|
8h30
|
30,79
|
13h
|
2442,87
|
|
Composition of the envelope Simulation
|
|
|
Rubble
|
Floor on vaults
|
1,32
|
2h
|
30,05
|
11h
|
1672,13
|
|
Hollow body floor
|
1,46
|
4h
|
30,47
|
12h
|
1808,23
|
|
Solid bricks
|
Floor on vaults
|
1,29
|
2h
|
29,95
|
10h
|
1577,35
|
|
Hollow body floor
|
1,43
|
4h
|
30,38
|
11h30
|
1690,18
|
|
Solar Protections Simulation
|
|
|
Projections
|
50 cm
|
1,49
|
5h30
|
30,58
|
12h30
|
1911,02
|
|
80 cm
|
1,49
|
5h30
|
30,56
|
12h30
|
1888,18
|
|
Balcony
|
150 cm
|
1,48
|
5h30
|
30,54
|
12h
|
1861,46
|
|
Rates and Type of glazing
|
1,54
|
7h30
|
30,72
|
13h
|
1909,59
|
|
Orientation
|
|
|
North
|
1.56
|
7h
|
30.79
|
15h
|
2290.12
|
|
East
|
1.66
|
8h
|
31.07
|
15h
|
2596.70
|
|
South
|
1.64
|
8h
|
31.01
|
15h
|
2791.63
|
|
West
|
1.57
|
8h
|
30.81
|
14h
|
2227.26
|
|
|
|
|
|
|
|
|
|
Concerning the first parameter, in relation to the composition of the envelope, it can be noticed that it is the most influential parameter both in the evaluation of interior thermal comfort and in terms of energy consumption (Chabchoub & Kharrat, 2020). The second parameter, relating to the addition of solar protection, strongly correlates with ambient temperatures (risk of overheating) due to the excessive use of glazed surfaces in contemporary buildings. The results show that solar protection improves comfort and reduces energy consumption. The wider the sun protection, the less energy the building consumes. The results of the third parameter (modification of the rate and type of glazing) show that even if this parameter weakly influences interior thermal comfort, it shows an average impact on the energy level. Finally, it has been demonstrated that the modification of orientations does not significantly affect the thermal quality of the contemporary building studied. However, the East and South orientations in buildings location increase energy consumption since they are the two orientations that are the least advantageous from a thermal point of view. However, this parameter remains strongly linked to the previous ones insofar as the openings (rate and type of glazing) in addition to the absence of solar protection can play a major role even in the best orientations.
4. Discussions
This trilogy of complementary research has the common objective of adapting Tunis’s built environment to climate change. Recall that, initially, a diagnosis of this adaptation for the city of Tunis was carried out, using a specific methodology: a cross-referenced five assessment tools to identify objectives and indicators used to draw up an inventory. At the end of this analysis, it turns out that at the urban level, only 20% of the objectives are achieved. This score shows that there are many gaps in urban planning, which will have to be considered to improve urban conditions. Regarding the architectural scale, and given the regulations in force in our country, the score is slightly better with 43% of objectives achieved (Jouini, Kharrat, & Achour-Younsi, 2019). However, it is possible, even fundamental, to correct these shortcomings to improve urban resilience (Stagrum, Andenaes , Kvande, & Lohne , 2020).
In a second phase and view of the importance of energy consumption challenges in cities, the two other studies complete this work by deepening the urban and architectural scales. Indeed, the interlocking of scales is essential to understanding the phenomenon of global warming and its impact on comfort within cities and their buildings. The research is interested in the degree of adaptation of the new built environment to this scourge that threatens our planet.
The more thermally comfortable a city is, the more its buildings will be, and the less energy they will consume. For this reason, the first step was to assess the impact of urban morphology on the outdoor thermal comfort of cities. Indeed, as designers, we have the heavy task of conditioning the thermal quality of our cities. Thus, upstream of the architectural design, it is essential to plan in an environmentally conscious way.
To do this, this second study was interested in the impact of various morphological indicators at the neighborhood and street level on outdoor thermal comfort. The results showed a strong correlation between built and plant densities at the district level. Indeed, by limiting urban sprawl and opting for a higher built density, the effect of the urban heat island, which is an alarming indicator of the poor thermal quality of our cities, can be reduced. As far as vegetation is concerned, its role is no longer to be demonstrated and its impact on the cooling of the thermal environment. At the street level, it turns out that the higher the H/W ratios, the more the street is thermally comfortable (Achour - Younsi & Kharrat, 2016). This is due to the reduction of solar radiation which affects the surfaces of the streets, and subsequently avoids the radiative trapping phenomena, which causes the overheating of space.
Moreover, being that the H/W and SVF have a high link, the latter is an equally significant indicator of outdoor thermal comfort (Svensson , 2004). It is also noted that albedo is a crucial component of outdoor thermal comfort in that it determines the mean radiant temperature value which strongly correlates with comfort (Schrijvers, Jonker, De Roode, & Kenjeres, 2016). These main morphological characteristics prove to be those of the urban planning of yesteryear, and our new cities, with their urban regulation, are not efficient from a thermal point of view. Thus, if designers master outdoor thermal comfort, the immediate environment of the buildings will be more lenient for them, who will not consume a lot of energy.
From this perspective, the third and last part of this research is to close the problem, by analyzing the thermal comfort conditions inside the buildings and by evaluating their energy consumption. The results showed that the newly built environment of the city of Tunis is not adapted to climate change and that the old buildings are more thermally comfortable. As a result, the oldest buildings consume less energy for air conditioning than new buildings. Furthermore, it has been shown that energy consumption is strongly linked to air conditioning and thermal comfort regulation.
5. Conclusions
Climate change is one of the most worrying issues of the 21st century, given the environmental, socio-economic, and health risks it can cause. Adapting to this climate change in cities has become a necessity or a priority. Architects, urban planners, and all stakeholders are responsible for mobilizing to mitigate the risks associated with the building sector. From gas emissions to the most frightening energy consumption, the building is an essential chapter in the current crisis. To this end, this research was interested, in the first stage, in evaluating the situation in the city of Tunis, with the aim, first, establishing a diagnosis of the adaptability of buildings to climate change, then determining the shortcomings that need to be remedied. The results showed that more than half of the indicators are incomplete at urban and architectural scale. Then it appears that thermal comfort and energy consumption are the two most deficient factors in the environmental diagnosis in Tunis.
Moreover, the results showed that at all stages, there are actors who are responsible for this poor score. It was, therefore, possible to list possible action levers to improve the situation. Thus, avoiding isolated housing types and limiting urban sprawl, in urban and district planning is recommended. Furthermore, it is important to perform thermal studies and rethink the materials used, like reducing asphalt and increasing the vegetation of roofs and floors. Concerning the architectural scale, it appears essential to consider a bioclimatic conception using solar protection, integrating renewable energies, and improving the envelope quality. The following two stages of the research went deeper into these factors by looking for the most influential morphological and physical indicators of thermal comfort first, then on the impact of energy consumption. It appeared that at the urban and architectural scale, it is essential to consider these indicators which directly impact the quality of life of city dwellers.
For the specific context of the city of Tunis, and its climate classified as the subtropical Mediterranean,
the results showed that it is recommended to limit urban sprawl by increasing the built density and the H/W ratio. Furthermore, it is also recommended to consider the envelope’s composition by using suitable materials and installing solar protection.
Thus, these morphological and physical indicators that are the most significant indicators in thermal comfort and energy consumption can be categorized into three main classes:
- Forms: urban density, building compactness, shape coefficients, street shapes, orientations, solar protections, etc.
- Materials: ground surface materials, surface albedo, building envelope, insulation, etc.
- Minerality: plant density, bodies of water
This modest work is only the beginning of a tedious research project that sounds the alarm and tends to attract decision-makers attention.
Future research will therefore have to go deeper into these three categories by including in-depth analyses concerning the most suitable urban settlements for the climate and the construction materials most suited to the local context. The results will thus be able to draw up guidelines for designers to consider urban planning that is more respectful of the environment and buildings that consume less energy.
Acknowledgment
This research received no specific grant from public, commercial, or not-for-profit funding agencies.
Conflict of Interests
The authors declare no conflict of interest.
Data availability statement
The original contributions presented in the study are included in the article/supplementary material, further inquiries can be directed to the corresponding author/s.
Ethics statements
Studies involving animal subjects: No animal studies are presented in this manuscript.
Studies involving human subjects: No human studies are presented in this manuscript.
CRediT author statement:
Conceptualization: S.A.Y., F.K., Data curation: S.A.Y., A.C., N.E.H.J, Formal analysis: S.A.Y., A.C., N.E.H.J, Investigation: S.A.Y., A.C., N.E.H.J, Methodology: S.A.Y., A.C., N.E.H.J, F.K., Project administration: S.A.Y, Writing—original draft: S.A., A.C., N.E.H.J., Writing—review and editing: S.A.Y. All authors have read and agreed to the published version of the manuscript.
A.F.N.O.R. (1995). ISO N 7730 - Ambiances thermique modérées, Détermination des indices PMV et PPD et spécification des conditions de confort thermique[Moderate thermal environments Determination of PMV and PPd indices and specifiaction of thermal comfort conditions]. AFNOR, Paris.
Achour-Younsi, S., & Kharrat, F. (2016). Outdoor thermal comfort: impact of the geometry of an urban street canyon in a Mediterranean subtropical climate–case study Tunis, Tunisia. Procedia-Social and Behavioral Sciences, 216, 689-700. https://doi.org/10.1016/j.sbspro.2015.12.062
A.N.M.E. (2005). Label résidentiel: Initiation à la réglementation thermique et énergétique des logements neufs [Residential label: Introduction to thermal and energy regulations for new housing] . Agence Nationale pour la Maîtrise de l'Energie.
Ait-Ameur, K. (2002). Characterization of the microclimate in urban spaces through the validation of a "morpho-climatic" indicator system. Proceedings of PLEA, 306. The 19th Conference on Passive and Low Energy Architecture, Toulouse, France
Bouden, C., & Ghrab, N. (2005). An adaptative thermal comfort model for the Tunisian context: a field study results. Energy and Buildings, 37(9), 952-963. https://doi.org/10.1016/j.enbuild.2004.12.003
Bröde, P., Blazejczyk, K., Fiala, D., Havenith , G., Holmer, I., Jendritzky, G., & Kampmann, B. (2013). The Universal Thermal Climate Index UTCI compared to ergonomics standards for assessing the thermal environment. Industrial Health, 51(1), 16-24. https://doi.org/10.2486/indhealth.2012-0098
Carter, J., Cavan, G., Connelly, A., Guy, S., Handley, J., & Kazmierczak, A. (2015). Climate change and the city: Building capacity for urban adaptation. Progress in Planning, 95, 1-66. https://doi.org/10.1016/j.progress.2013.08.001
Chabchoub, A., & Kharrat, F. (2020). Towards energy efficiency in contemporary buildings from downtown Tunis. (L. Editore, Ed.) Sustainable Mediterranean Construction SMC, Focus on SDG 2030 City and Land, 12(1), 216-220.
Climate Change. (2022). Impacts, Adaptation and Vulnerability. IPCC Sixth Assessment Report. Retrieved from http://www.ipcc.ch/report/ar6/wg2/
Degelman, L. (2002). Which came first - building cooling loads or global warming? - a cause and effect examination. Building Services Engineering Research and Technology, 23(4), 259-267. https://doi.org/10.1191/0143624402bt049oa
Envirobat. (2012). Association Envirobat BDM. Retrieved from Villes et Aménagement durable, BDM - Bâtiments Durables Méditerranéens - Logements Collectifs: Retrieved from http://www.enviroboite.net/
Gauzin-Müller, D. (2009). L'architecture écologique du Vorarlberg [Ecological architecture of Vorarlberg]. un modèle social, économique et culturel. Paris: Éditions du Moniteur.
Girgis, N., Elariane, S., & Abd Elrazik, M. (2016). Evaluation of heat exhausts impacts on pedestrian thermal comfort. Sustainable Cities and Society, 27, 152-159. https://doi.org/10.1016/j.scs.2015.06.010
Goudie, A. (2018). Human impact on the natural environment. Wiley-Blackwell. ISBN: 978-1-119-40373-9.
Hutner, S., & Bruse, M. (2009). Numerical modeling of the urban climate - a preview on ENVI-met 4.0. 7th International Conference on Urban Climate ICUC - 7, 29. Yokohama - Japan.
Jin, H., Cui, P., Wong, N., & Ignatius, M. (2018). Assessing the effects of urban morphology parameters on microclimate in Singapore to control the urban heat island effect. Sustainability, 10(1), 206. https://doi.org/10.3390/su10010206
Jouini, N., Kharrat, F., & Achour-Younsi, S. (2019). Urban morphology and solar gains in cities in warm Mediterranean climate: Comparison of two collective residential complexes in Tunis, Tunisia. In S. Cham (Ed.), Euro-Mediterranean Conference of Environmental Integration, (pp. 2241-2245). https://doi.org/10.1007/978-3-030-51210-1_351
M.A.L.E. (2020). Troisième Communication Nationale de la Tunisie au titre de la Convention Cadre des Nations Unies sur les Changements Cimatiques [Third NAtional Communication of Tunisia under the United Nations Framework of Convention on Climate Change] Ministère des Affaires Locales et de l'Environnement. Tunis: Programme des Nations Unies pour le Développement PNUD. Retrieved from http://www.unfccc.int/sites/default/files/resource/Synthese%20TCN%20FR%20VF%20Tunisia.pdf
Madec, P. (2002). Architecture et qualité environnementale [Architecture and environmental quality]. Les Annales de la Recherche Urbaine(92), 140-142. https://doi.org/10.3406/aru.2002.2468
Magnier, L., & Haghighat, F. (2010). Multiobjective optimization of building design using TRNSYS simulations, genetic algorithm, and Artificial Neural Network. Building and Environment, 45(3), 739-746. https://doi.org/10.1016/j.buildenv.2009.08.016
Matisoff, D., Noonan, D., & Mazzolini, A. (2014). Performance or marketing benefits? The case of LEED certification. Environmental Science & Technology, 48(3), 2011-2007. https://doi.org/10.1021/es4042447
Mourid , A., El Alami , M., & Kuznik, F. (2018). Experimental investigation on thermal behavior and reduction of energy consumption in a real scale building by using phase change materials on its envelope. Sustainable Cities and Society, 41, 35-43. https://doi.org/10.1016/j.scs.2018.04.031
Sansen, M., Martinez, A., & Devillers, P. (2021). Mediterranean Morphologies in Hot Summer Conditions: Learning from France's "Glorious Thirty" Holiday Housing. Journal of Contemporary Urban Affairs, 5(1), 19-34. https://doi.org/10.25034/ijcua.2021.v5n1-2
Schrijvers, P. J. C., Jonker, H. J. J., De Roode, S. R., & Kenjereš, S. (2016). The effect of using a high-albedo material on the Universal Temperature Climate Index within a street canyon. Urban Climate, 17, 284-303. https://doi.org/10.1016/j.uclim.2016.02.005
Song, X., & Ye, C. (2017). Climate change adaptation pathways for residential buildings in southern China. Energy Procedia, 105, 3062-3067. https://doi.org/10.1016/j.egypro.2017.03.635
Svensson, M. K. (2004). Sky view factor analysis–implications for urban air temperature differences. Meteorological applications, 11(3), 201-211. https://doi.org/10.1017/S1350482704001288
Stagrum, A., Andenaes , E., Kvande, T., & Lohne , J. (2020). Climate change adaptation measures for buildings - A scoping review. Sustainability, 12(5), 1721. https://doi.org/10.3390/su12051721
UNEP. (2018). Global alliance for buildings and constrcution, Towards a zero-emission, efficient and resilient buildings and constrcution sector. Internationall Energy Agency . Global Status Report. Retrieved from http://www.unep.org/resources/report/global-status-report-2018
Viguié, V. (2020). Les villes et le climat: Bâtiments et urbanisme [Cities and Climate: Buildings ans Urban Planning]. (Géoscience, Ed.) Comptes rendus, 352(4-5), 363-372. https://doi.org/10.5802/crgeos.19
Wang, X., Chen, D., & Ren, Z. (2011). Global warming and its implication to emission reduction strategies for residential buildings. Building and Environment, 46(4), 871-883. https://doi.org/10.1016/j.buildenv.2010.10.016
Ye, G., Yang , C., Chen, Y., & Li , Y. (2003). A new approach for measuring predicted mean vote (PMV) and standard effective temperature (SET*). Building and Environment, 38(1), 33-44. https://doi.org/10.1016/S0360-1323(02)00027-6
*Corresponding Author:
LaRPA, Carthage University, National School of architecture and urbanism, Tunis, Tunisia
Email address: safa.achouryounsi@enau.ucar.tn

Achour-Younsi, S., Chabchoub, A., Jouini, N. E. H., Kharrat, F. (2022). A Proposal to Mitigate Energy Consumption through the Sustainable Design Process in Tunis. Journal of Contemporary Urban Affairs, 6(2), 193-205. https://doi.org/10.25034/ijcua.2022.v6n2-6